- Air Homepage
- Upper Atmosphere
- Thunderstorm Cumulonimbus Clouds
The Secrets of Thunderstorm Cumulonimbus Clouds
How do we get
thunderstorm cumulonimbus clouds?
You might be inspired by the power of nature and the intense feelings that accompany thunderstorms. Thunderstorms captivate us all at times because they're awe-inspiring and terrifying at the same time.
Cumulonimbus clouds and the thermodynamics of terror - What makes warm, moist air scream twelve miles high to form a cumulonimbus thunderstorm? Discover the critical energy levels that meteorologists plot on a thermodynamic chart to predict when the next lightning, hail, or tornado might strike.
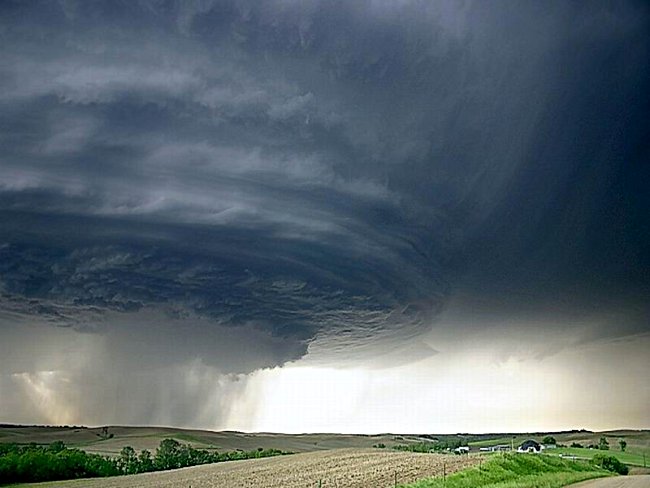
Cumulonimbus clouds form when warm, moist air rises quickly and cools as it reaches higher altitudes. Clouds generally appear when moisture condenses.
Thunder and lightning are caused by an electrical discharge causing rapid expansion of air in a storm. The noisy thunder is caused by this expansion.
Thunderstorms scare someone?
Thunderstorms can be loud and abrupt, which can startle people. Lightning flashes can also be startling and unpredictable. Furthermore, thunderstorms can damage property and even put people at risk. They also inspire many people.
Here is some of the science behind these storms
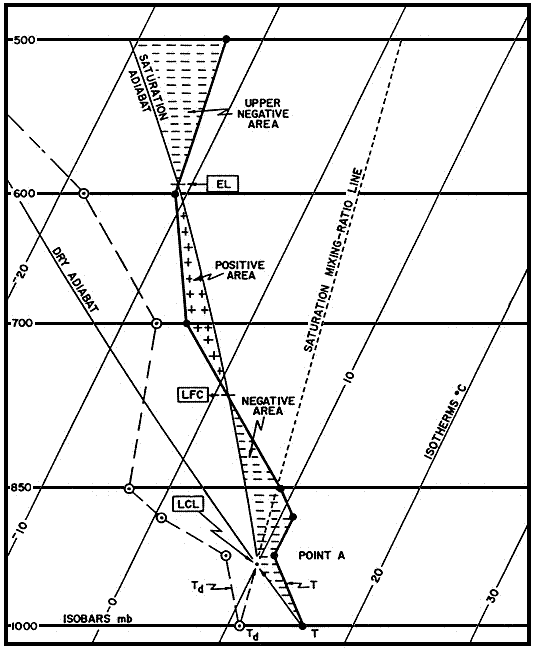
On a graph like this one, meteorologists plot daily soundings and assign Convection Parameters. See them listed below. The graph presented is called a Skew T - Log P. Using the Skew-T Log-P diagram, meteorologists can identify the potential for thunderstorm formation and predict their severity.
Skew-T Log-P diagrams are commonly used in meteorology to analyze the thermodynamic state of the atmosphere and identify thunderstorm potential. The diagrams have a vertical axis for pressure (in log scale) and a horizontal axis for temperature (in skew scale).
The data on the diagram comes from weather balloons or airplanes measuring temperature, pressure, and humidity. Meteorologists usually look for a few key features on the Skew-T Log-P diagram to identify thunderstorm potential:
-Convective Available Potential Energy (CAPE): This is the amount of energy in the atmosphere that can cause convection. This is the area between the environmental and parcel temperatures. Thunderstorms are more likely to develop when CAPE is high.
-LCL: Lifted condensation level is where a parcel of air would get saturated if lifted to that level. It's possible to tell how deep thunderstorm clouds will be by the height of the LCL. See below.
-Convective Inhibition (CIN) measures the amount of energy needed to overcome atmospheric stability and start convection. CIN values below zero indicate a thunderstorm is brewing.
The elements in the drawing:
T - Surface temperature, usually around 1000 mb pressure. Also identifies the right hand curve on a skew T log P chart.
Td - Surface mixing ratio, absolute humidity. On the chart, it also identifies the left side curve.
LCL - Lifting condensation level, lower left corner of the negative area, where dry adiabat and mixing ratio pass through surface temperature and dewpoint. Cumulonimbus clouds at the bottom of a thunderstorm.
LFC - Level of free convection, lower corner of positive area. To keep moving upward on its own, the surface parcel must be lifted.
CCL - When enough heat is accumulated below, the descending LFC meets the rising LCL at the convective condensation level.
Tc - Convective temperature, the surface temperature on the dry adiabat at which LCL and LFC meet to form CCL and free convection.
Positive Area - A positive area is where a lifted parcel gets warmer than ambient air.
Negative Area - stable region where the lifted parcel is colder than the surrounding air.
EL - At the top of the positive area, where the parcel ascent curve intersects the environmental curve above the LFC, is the equilibrium level. This is a typical cloud top.
EBL - Energy balance level: The EBL is not shown, but somewhere in the upper negative area, just high enough so that the area below the EBL within the upper negative area is equal to the area below the EBL. Normally, this is the top of the storm clouds.
Tc is often unrealistic and hard to reach. That's the top boundary of surface-based convection.
Elevated Convection leads to Thunderstorm Cumulonimbus Clouds
Time Lapse of thunder storm
Convection forms thunderstorm cumulonimbus clouds. How? Warm air rises, and cool air sinks during convection.
In the atmosphere, convection is usually caused by the sun heating the Earth's surface below. Water vapor condenses into clouds as warm air rises leaving behind latent heat which destabilizes the air above.
When there's a lot of moisture in the air and the air turns very unstable, convection can become more vigorous and lead to thunderstorm cumulonimbus clouds. Tall, towering clouds, with tops reaching as high as 12 miles (20 kilometers) above Earth's surface, are characterized by their tall, towering appearance.
Thunderstorm cumulonimbus clouds often bring heavy rain, lightning, strong winds, and hail. Some of them can produce tornadoes.
Layers slip past each other, so convection starts at some upper level. It either happens or it doesn't. There are two possibilities to consider.
The warm air slips under the colder air or the colder air flows over the warm air.
Warm air moving in - differential thermal advection they call it. Moisture is also needed in warm air.
Once it contacts the colder air above, up it goes. Then we can figure out the LCL and cloud base using the same graphical techniques.
Observers might see alto cumulus castellanus (ACC) or cumulonimbus clouds (CB), which are different types of clouds.
Go back from this Thunderstorm Cumulonimbus Clouds to the
Chasing Storms web page.
#36
Search this site for more information now.
How do you forecast thunderstorm cumulonimbus clouds?
You can never be too far away from cumulonimbus clouds when you hear a thunderstorm. Is it possible to forecast them?
Do you have concerns about air pollution in your area??
Perhaps modelling air pollution will provide the answers to your question.
That is what I do on a full-time basis. Find out if it is necessary for your project.
Have your Say...
on the StuffintheAir facebook page
Other topics listed in these guides:
The Stuff-in-the-Air Site Map
And,
Thank you to my research and writing assistants, ChatGPT and WordTune, as well as Wombo and others for the images.
OpenAI's large-scale language generation model (and others provided by Google and Meta), helped generate this text. As soon as draft language is generated, the author reviews, edits, and revises it to their own liking and is responsible for the content.


New! Comments
Do you like what you see here? Please let us know in the box below.