- Air Homepage
- Upper Atmosphere
Chasing Storms on a Weather Map
We know meteorologists spend a lot of time chasing storms
and systems
across their weather maps.

Here's a guide to midtropospheric weather maps: Decoding the Winds Aloft - Ever wonder what meteorologists see when they track storms like Katrina? Find out how to predict a storm's rotation and intensity by mastering the 500-millibar map (20,000 feet above you!)
What are these meteorologists doing? Their job is to analyze mid-tropospheric circulation, which usually happens between 10 and 20 thousand feet above sea level. Maps help them do that.
Using an upper air map effectively can be incredibly enriching for students. Knowing this stuff has a lot of benefits. It's a great way to learn about meteorology. Understanding the art of predicting storms can give us a better understanding of our environment.
You can develop valuable skills by studying storm-chasing techniques and using upper air maps. Analyzing calm areas, identifying trouble spots, and understanding flow dynamics sharpen critical thinking and problem-solving skills. Besides meteorology, the skills can be applied to lots of other things.
It can also foster a sense of wonder and curiosity about nature. Understanding powerful weather phenomena opens up a world of exploration, adventure, and thrills. A solid foundation in meteorology, climatology, or related fields is provided by this course.
What do they contain? Routine operational maps show the state of the upper atmosphere at standardized levels. Air pressure levels of 85, 70, 50, and 25 kiloPascals.
Mid-latitude westerly winds blow here and everything moves eastward. On the map, we might see calm, clear areas chasing storms along streamlines.
Normally, changes in our weather are accompanied by bumps or waves. Most horizontal motion in the air is caused by systems that follow features such as storms and slide across either the upper-air or surface weather map. They call it a transformation. And at these altitudes, systems don't change much in size over time.
This is what we call the level of non-divergence, or LND. This happens halfway up the troposphere, which is the lowest major layer in the atmosphere.
This vertical level is set by the World Meteorological Organization at 50 kPa, or 500 millibars, about 20,000 feet above sea level. By using this level, air moving upwards or downwards cannot be constrained by boundaries like the tropopause or the earth's surface, which would force vertically-moving air to change directions.
Chasing storms in any direction
How cool would it be to get your pilot's license and chase storms in your own plane. Renting one might be a better option.
You might be surprised how many different ways air can flow. Try to understand these four quantities used to describe flow characteristics so you can read meteorological weather maps:

1)
Translation
– chasing storms horizontally across the map. Storms move from one place to another,
2)
Deformation
– change in shape, like squeezing a ball of dough without changing its size. Like other fluid bodies, weather systems change shape all the time.
3)
Divergence (and convergence) – spreading out and increasing (or decreasing) a parcel's flow area. The intensity of a storm changes, and
4)
Vorticity
– rotation about a vertical axis, which may also be moving. It's a good indicator of precipitation intensity to look at vorticity. Tornadoes may also result from it.
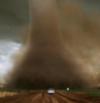
The movie Twister with Helen Hunt and Bill Paxton is about weather people experimenting
and chasing storms. Take the time to see it.
Have you seen it? Let us know what you think (right here) of this or any similar movie. Otherwise, read on for more about weather systems.
Loved it or Hated it?
Have you seen the show? Have you heard too much about it? Are you sick of it or did you love it?
Give us yer thoughts...Spill yer guts. We'd like to know.
Great critics before you.
See reviews from previous visitors to this page...

Twister = Oz's Power - I respect both movies, now! 
This movie captured the danger of a twister of any size. I was at a Jellystone campground on a sunny day and witnessed a waterspout-like dust devil …

Twister = good, Bill Paxton = bad
I'm from Kansas, so my favorite weather related movie will always be The Wizard of Oz. I can't help it. This is programmed into us at birth.
However, …
I loved the movie Twister.
I thought Twister was a great movie. It was also a good way to learn something you might otherwise not be interested in finding out about.
The article …

never got a chance to watch it.
I have heard of the movie Twister but I never got a chance to watch it. It seems very interesting. I'm probably going to watch it.
I think this is …
The Perfect Storm
Also a great movie that i like is The Perfect Storm... they show you a real-life situation, and what must be done in a time like that.
Barry's Response …

I thought it was good. 
I watched the movie Twister a few times and I thought it was pretty decent. I remember another movie about tornadoes, I think it was called "Night of the …

Interesting Weather Facts
Twister is a great movie that is both fun and informational. I think that people of all ages can enjoy the action in the movie, but also get a taste of …
Love the weather Not rated yet
Tornados have been becoming more of a problem for the entire southern US and the north border over to the north east. Hurricane Katrina reached all the …

I loved it. Not rated yet
Twister was a very intense movie. Iv'e watched it many many times. I would recommend it to people who havnt seen it. Great movie!
Barry's Response …

weather movie Not rated yet
Absolutely LOVE any weather movie. As weather changes every single day we tend to take it for-granted.
Barry's Response - Weather and natural disaster …

It was alright Not rated yet
My first impression was that the movie was very good. It was interesting, but the science was bad. The science, which was somewhat explained here, was …

Okay Not rated yet
Some of the science materials was completely made up, and fake but the acting wasn't bad.
Barry's Response - The storyline wasn't as important as …
Weather forecasters need to know this relationship between temperature and pressure.
In some cases, all four modifications are happening at the same time and moving with weather systems to make chasing storms more exciting and challenging.
Analytical and prognostic weather maps define pressure-related systems by how high above sea level one must go until ambient pressure drops to a specified millibar level. As you move toward the north or south pole, the height for each standard level decreases.
For example, look at a North American map with USA weather
contours at 500 millibars. Different parts of the country have heights that differ by 500 metres or more. That makes sense thermodynamically. The colder surface air that chases or follows storms in mid-latitudes is denser, in grams per cubic metre, than the warmer, more humid
air elsewhere.
These colder regions will have a sharper drop in pressure as altitude increases. Comparatively, sea-level pressures don't change as rapidly.
It doesn't matter whether we're chasing storms by looking at a low spot on a height contour map like this one or a minimum pressure area on a constant altitude map, like our normal sea-level equivalent pressure maps used to show surface isobars. Both types of maps show similar lows and highs.
Things to keep in mind. In the northern hemisphere, the flow is counter-clockwise around lows and clockwise around highs. Clouds are associated with lows, while clear skies are usually associated with highs.
Want to know more? Here are some other things to consider.
Upper Air Analysis and Radiosondes
Use the first law of thermodynamics.
The radiosondes on the weather balloon in this photo gather data. The first law of thermodynamics and other scientific principles can help you interpret this. Keeping the balloon aloft and transporting its instruments depends on buoyancy.
Water vapor maps and other tools.
Weather forecasters use water vapor maps, prepared with radiosonde data, to figure out moisture patterns.
Unique temperature conversions
for weather forecasters
Scientists can use average temperature conversions to look at temperatures and use the information.
Wireless thermometers and weather balloons
Radiosonde instruments, like wireless thermometers and humidity gauges, have certain characteristics.
Rough weather convection currents
Instability patterns cause air mixing, weather convection currents, and sometimes severe storms. The importance of lapse rates and inversions.
How different types of clouds form
Different types of clouds will result from different air motions. Clouds get their shapes from air moving up and down.
Explain humidity
and its consequences
Forecasters spend a lot of time explaining humidity and what can happen when it changes. How come? Massive heat energy easily converts into severe storms.
Find out what thunderstorm cumulonimbus clouds are.
Whenever you hear a thunderstorm, cumulonimbus clouds aren't far away. Is it possible to forecast them?
Causes of lightning thunder and storms
Lightning, thunder, and severe storms: what causes them? Do instability and convection just appear out of nowhere? Possibly.
Stable air, weather inversions
When we get weather inversions, what do we see? How do they happen? Here's what you need to know.
Reading about storm-chasing and using upper air maps gives students a compelling combination of science knowledge, skill development, and awe-inspiring weather wonders. Last but not least, I have made it easy for you to link to this page.

#9
Recent Articles
-
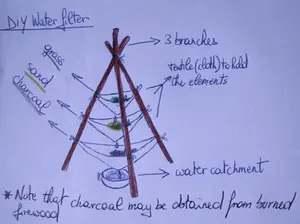
water purifier
Feb 07, 26 06:47 PM
 Reality Filtering by Your Mind and the Earth - Get ready to hack your own brain and forget everything you've been told. You're about to discover how to
 -
Your Website
Feb 04, 26 10:42 PM
 Everything's in balance - Imagine your biggest rival holds the key to winning. This talk flips the script: heavy air and heated arguments aren't problems,
 -
How permanent is a permanent marker on fabric?
Feb 02, 26 12:26 AM
 Can you beat a permanent marker? - Do you think that ink stain on your favorite shirt stays there forever? Let's see how chemistry breaks the rules and

Is it possible to chase storms with just a map?
Take on the exhilarating adventure of storm-chasing with an upper air map. Learn how to predict storm locations by analyzing calm areas, identifying trouble spots, and analyzing fluid dynamics closely. The thrill of storm-chasing awaits you when you unleash your meteorological prowess and harness the power of an upper air map.
Do you have concerns about air pollution in your area??
Perhaps modelling air pollution will provide the answers to your question.
That is what I do on a full-time basis. Find out if it is necessary for your project.
Have your Say...
on the StuffintheAir facebook page
Other topics listed in these guides:
The Stuff-in-the-Air Site Map
And,
Thank you to my research and writing assistants, ChatGPT and WordTune, as well as Wombo and others for the images.
OpenAI's large-scale language generation model (and others provided by Google and Meta), helped generate this text. As soon as draft language is generated, the author reviews, edits, and revises it to their own liking and is responsible for the content.
You are here:
Most Popular Pages on this Website:
Pictures of Global Warming
- See photos, cartoons, charts, graphs and a few surprises.
Clouds
- Don't know a cumulus from a stratus? Check here.
Causes of Global Warming
- It's not always obvious.
Calgary Alberta Weather
- Example of Canadian Goodness.
Thermometers
- Our favourite weather instrument.
- Home
- Contact Us
- Free E-zine Back Issues
- Privacy Policy
- Site Map - I'll help find something good.
By Barry Lough, P.Met., EP (Environmental Professional)
Text copyright © 2003-2024 Stuff in the Air.com
BACK TO TOP - Hit your 'Home' Key
New! Comments
Do you like what you see here? Please let us know in the box below.