- Air Homepage
- Alberta Air Quality
- Alberta Air Monitoring Directive
- Air Quality Consultant
In Alberta, an air quality consultant found a much more complex environmental story
The wind did not care about schedules, budgets, or politics. This air quality consultant did.

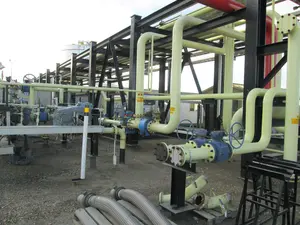
The air moved across northern Alberta exactly as it always had, carrying heat, moisture, dust, exhaust, and invisible gases through a landscape crowded with refineries, petrochemical plants, cogeneration units, fertilizer operations, and flare stacks stretching into the prairie sky. Somewhere inside that industrial maze stood a great natural gas liquids fractionation facility, a site preparing for expansion through a proposed new onsite feature.
For this industrial client, the challenge looked deceptively simple: prove the expansion would comply with Alberta’s strict air quality standards. But in Alberta’s Industrial Heartland, simple questions rarely stay simple.
Science in the Crosswinds
The task landed on the desks of the dispersion modellers at Calvin Consulting Group Ltd. The air quality consultant in charge understood immediately what was at stake. A project approval could hinge on a few micrograms per cubic metre. One modelling error could delay construction, trigger regulatory concerns, or create uncertainty around public safety and environmental performance.
The mission was clear. Discover whether emissions from the Facility — especially Nitrogen Dioxide (NO2) and Sulphur Dioxide (SO2) — could significantly affect air quality in the surrounding region.
The investigation began with the atmosphere itself.
What did the team of Air Quality Consultants do?
They gathered five years of meteorological data from Alberta Environment and Protected Areas, covering every hour between January 2015 and December 2019. Using the AERMET processor and the U.S. EPA’s AERMOD dispersion model, they transformed raw weather observations into something more powerful: a living map of how air moved across the region.

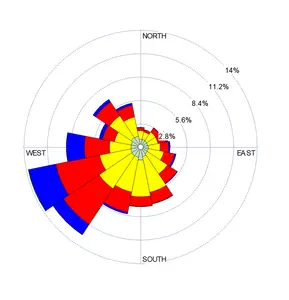
The windrose told an important story. Winds came predominantly from the west and southwest, shaping where emissions would travel and where maximum concentrations might appear. But wind alone was not enough. The terrain mattered too.
Using geospatial elevation data from Natural Resources Canada, Calvin Consulting processed surrounding topography through AERMAP. Hills, subtle elevation changes, industrial structures, and land use categories all influence how pollutants disperse. Air behaves differently over forests than over industrial yards. A valley can trap emissions. Buildings can pull plumes downward unexpectedly.
The Industrial Maze
So the air quality consultant-team built the world digitally, piece by piece.
Thousands of receptors were placed across the landscape. Some sat every 50 metres near the Facility. Others stretched outward to ten kilometres. Additional receptors surrounded predicted concentration hotspots at intervals of only 20 metres. Every possible area of concern had to be captured.
 Future plant site and surroundings
Then came the harder realization. The Facility did not exist in isolation.
Within five kilometres stood a dense network of neighbouring industrial operations: refineries, chemical complexes, fertilizer plants, hydrogen manufacturing facilities, cogeneration units, petrochemical operations, flares, heaters, boilers, and stacks reaching over one hundred metres high. Each emitted its own share of NOx and SO2 into the atmosphere.
Truth emerges from scenarios
The modelling would need to separate truth from assumption.
The air quality consultant established three separate scenarios. First came the Baseline Case: neighbouring industrial emissions without the facility itself. Second came the Facility Case: emissions from the target facility alone. Third came the Cumulative Case: everything combined.
The Facility emissions themselves appeared modest. Hot oil heaters and mole sieve regeneration heaters operated continuously, but sulphur dioxide emissions occurred only intermittently when sulphur-gas was combusted. Still, Alberta’s Air Quality Model Guideline demanded rigor.
NOx emissions had to be converted into NO2 using the Plume Volume Molar Ratio Method built into the model. Background ozone concentrations had to be found and incorporated. Building downwash effects were calculated using client information and the U.S. EPA Building Profile Input Program. Roof heights, structures, heater locations, and neighbouring industrial buildings all influenced how plumes would behave.
 Consider our Neighbours
The modelling systems churned through immense combinations of meteorology, terrain, emissions, chemistry, and operating conditions.
Then the first results appeared. The Baseline Case produced predicted concentrations exceeding Alberta Ambient Air Quality Objectives. So, naturally, did the Cumulative Case.
That moment mattered. At first glance, exceedances can trigger alarm. Headlines form quickly around phrases like non-compliance. But experienced modellers know something important: context changes everything.
The Facility itself was not the primary driver.
Tiny impact in a big system
When the air quality consultant isolated emissions from the Their Facility alone, the results told a completely different story. Predicted one-hour NO2 concentrations were small, even after adding background concentrations. Annual concentrations remained dramatically below regulatory thresholds as well.
The same pattern emerged for sulphur dioxide. Even under conservative flaring assumptions — including six separate flare scenarios combined with simultaneous heater emissions — the Facility Case complied with all applicable Alberta Ambient Air Quality Objectives.
But the regional industrial environment told another story entirely, it seemed. When neighbouring industrial facilities were included, concentrations exceeded objectives under certain meteorological conditions. Massive industrial sources already operating throughout the region dominated cumulative concentrations. Large refineries, upgrader operations, fertilizer plants, and cogeneration units contributed the overwhelming majority of predicted impacts.
The key question became brutally precise: How much additional impact would the Facility create?
Tiny Impacts with Big Decisions
The answer emerged almost quietly... Less than one percent.
When Facility emissions were added to the already elevated regional baseline, predicted concentrations increased by less than 0.5% for NO2 and less than 1% for SO2. That changed the meaning of the entire assessment.
The Facility was not creating regional air quality problems. It was entering an industrial environment where existing neighbouring emissions already controlled cumulative outcomes. Under worst-case assumptions, the incremental contribution from the proposed expansion remained extremely small.
The science had done its job. But the story was larger than numbers on a spreadsheet.
Behind every receptor grid and emission factor stood real-world consequences. Regulatory approvals. Industrial jobs. Energy infrastructure. Community confidence. Environmental accountability. Millions of dollars in investment decisions depended on conclusions that had to withstand scrutiny from engineers, regulators, environmental scientists, and the public. That is why dispersion modelling matters.
Most people never see this hidden layer of industrial decision-making. They see facilities after construction, not the years of atmospheric analysis, terrain processing, emissions estimation, and regulatory evaluation sometimes required before approvals move forward.
Yet invisible gases shape visible realities. A few grams per second released from a stack can become a political issue, a permitting delay, or a public health concern if misunderstood or improperly assessed. Conversely, an air quality consultant with good science can prevent unnecessary fear while still protecting environmental quality responsibly.
In the end...
The conclusion became clear.
This facility complied with Alberta’s air quality objectives when assessed independently. Regional exceedances were driven primarily by surrounding industrial sources already operating within the area, with the assumption that their highest emissions ever take place throughout the year. The proposed Facility expansion contributed only a negligible increase to predicted cumulative concentrations.
The winds still crossed Alberta from the west and southwest exactly as before. But now, someone understood what those winds carried, where the emissions travelled, and why the numbers mattered. The air quality consultant.
And because of that understanding, decisions could move forward grounded not in speculation, but in evidence.

Let us help you deal with the Alberta Air Monitoring Directive
Visible problems rarely complicate industrial approvals. Trouble usually begins with invisible problems.
From a flare stack, a few grams per second. The direction of the wind is shifting. An emergency release that was underestimated. Regulators ask hard questions, schedules tighten, investors become uneasy, and millions of dollars sit idle.
Calvin Consulting Group Ltd. changes the conversation at that point. Our advanced air quality dispersion modelling assessments help industrial companies move forward with confidence. Whether you need an operating approval, expansion assessment, emergency response evaluation, or public risk analysis, we deliver clear technical answers regulators can rely on.
We have some of the most experienced air quality consultants in Canada. We have more than 30 years of experience in the siting of meteorological and air quality monitoring stations. Among our five Principal Consultants, three have decades of combined experience in dispersion modelling.
By using AERMET or CALMET, we obtain and process five years of site-specific meteorological data, integrate terrain and land-use data, and prepare sophisticated AERMOD or CALPUFF simulations that include nearby industrial emissions. We then compare the results with provincial and federal environmental, health, safety, fire, explosion, and public risk standards.
Modelling is just one part of what you receive. As a result, you receive strategy, clarity, credibility, and momentum. Each Assessment includes professional reports with clear text, graphics, tables, and defensible conclusions.
Experience matters when it comes to approvals, timelines, reputation, and operational certainty.
Get in touch with Barry at Calvin Consulting Group Ltd.

and get the answers you need before uncertainty costs you money.
Recent Articles
-
Air quality consultant who uncovered emissions, tension, and truth
Jun 01, 26 03:34 PM
 Why air quality consultants can make a difference - industrial expansion turned into an investigation into atmospheric science with cumulative emissions
 -
Lead Us From Darkness To Light From Global Warming To Global Cooling by Gopal Panicker
May 27, 26 12:41 AM
 A secret cooling prediction that flips the script - Planet Earth isn't warming up because of us, and a giant wave of natural cooling is coming. Get ready
 -
Environmental Social and Governance in Alberta
May 26, 26 11:04 PM
 Environmental Social and Governance why this province stands out in safety and monitoring, even as emissions, politics, and enforcement create risk.
An industrial expansion in Alberta sparked a high-stakes investigation into air pollution, regulatory compliance, and invisible atmospheric risks.
Using advanced dispersion modelling, an air quality consultant tracked how Nitrogen Dioxide and Sulphur Dioxide moved across one of Canada's most industrialized regions. Everyone was surprised by the results.
While the facility itself complied with Alberta's strict standards, surrounding industrial operations had the biggest impact. This story shows how modern environmental science quietly shapes billion-dollar decisions through terrain analysis, meteorological modelling, flaring scenarios, and thousands of virtual receptors. Part engineering thriller, part environmental detective story, and all real.
Do you have concerns about air pollution in your area??
Perhaps modelling air pollution will provide the answers to your question.
That is what I do on a full-time basis. Find out if it is necessary for your project.
Have your Say...
on the StuffintheAir facebook page
Other topics listed in these guides:
The Stuff-in-the-Air Site Map
And,
Thank you to my research and writing assistants, and the author remains responsible for the content.
- Home
- Contact Us
- Free E-zine Back Issues
- Privacy Policy
- Site Map - I'll help find something good.
By Barry Lough, P.Met., EP (Environmental Professional)
Text copyright © 2003-2024 Stuff in the Air.com
BACK TO TOP - Hit your 'Home' Key