- Air Homepage
- Weather Maps
Forecast Map Weather: How it Guides Local Forecasts
On a forecast map weather data can look intimidating. Discover the secrets of weather patterns and gain a cosmic perspective on Earth's ever-changing atmosphere by exploring an upper weather map.

The Secrets of Upper Air Analysis: Beyond the Blue You can tell the weather tomorrow by those lines, swirls, and colored blobs on a forecast map. See the three-step secret meteorologists use to turn messy data into accurate forecasts.
Maybe you love weather maps and how they relate to the weather. It's fascinating to see how different air masses interact and influence the weather. By checking a map and using your knowledge, you can also predict the weather and understand the forecast better. Also, it's fun to track storms and hurricanes and see what they do.
Wanna know what's happening tomorrow? Forecasting weather requires skills from several different disciplines. Using science and technology, we predict the most likely state of the earth's atmosphere at any given time and place.
Looking for meteorological quantities, which we call fields? Want to compare weather across the country at once? You can look at huge amounts of data at a glance with a weather map.
I think there's something meaningful in that funny stuff. You can quickly see patterns in those fields. Highs and lows, troughs and ridges. The system also detects large areas of rainfall, warm, cold, and sunny weather.
In a forecast map weather patterns show up as predictions for the next few days. You can see what's going on, especially if you compare forecast maps every day. I find this to be useful when traveling.
What does a meteorologist do?
You might wonder how a meteorologist makes predictions with these maps. To illustrate, I made some notes after reading one of the operational meteorology training manuals.
How to organize a mess of information: When you have a bunch of official data such as that reported in METAR format, what should you do before you start working with it? How do we sort through these variables like temperature, pressure, etc. that are recorded in a network of hundreds of surface locations
such as airports? Meteorologists need a way to make sense of this.
Basically, familiarize yourself with METAR, determine the time period for your forecast, identify key variables, filter by location to narrow your focus, visualize the data, and compare it to historical data. Meteorologists can organize and analyze messy, complex data by following these steps. They'll be able to make better weather forecasts and predictions, and ultimately keep people safe and informed.
Is all this stuff really necessary? Using the forecast map weather professionals can use a variety of techniques to provide important interpretations for large organizations. Employers such as the
National Weather Service
or similar agencies. They make local weather forecasts and aviation weather forecasts.
Public forecasts can also be made by broadcast corporations like the Weather Channel, The Weather Network
and AccuWeather.
OK, how...? By
contouring, they sort and analyze the information. To do that, meteorologists draw curves (called isopleths) on the map connecting places with equal values for each variable and using distinct colors to represent the different types of quantity. This is the first of the tree step method, which includes analysis, diagnosis and prognostication.
In order to forecast weather, you need to collect and interpret weather data, figure out patterns and trends (analysis), understand atmospheric dynamics and weather features (diagnosis), and use computer models to predict the weather in the future (prognosis).
Extra sources for confirmation - They look for familiar patterns and compare their analyses with satellite
photos and
radar imagery to confirm or add to their conclusions. They can diagnose the weather and make a four-dimensional picture of the atmosphere by knowing the physics of the atmosphere. What does four dimensional mean? The usual three plus time.
Meteorologists are good guessers. With their forecast map weather wizards have to make quick decisions with limited data and may even use their knowledge of an area's history and known trends to fill in the gaps. Or even make a prediction that goes against what the raw data suggests.
Occasionally, meteorologists might stray from the usual forecasting techniques when Unusual Weather Patterns happen, data isn't enough for some reason, extreme risks are encountered under questionable safety circumstances, or new ideas are being tested. At this point, weather forecasters may have to use counterintuitive techniques. Ultimately, we want to make weather forecasts that are accurate and useful.
Forecast map weather applications
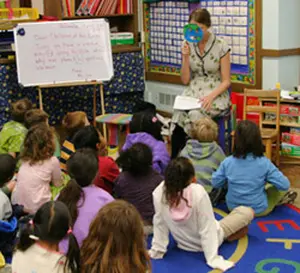
Teachers: How can you use forecast maps in the classroom?

Here are some general ideas on atmosphere lesson plans or how we make maps for each of these upper layers in our atmosphere. The links below will tell you more about higher elevations and their interactions with the atmosphere.
An example of a physics formula
or two getting applied to meteorology might interest older students.
Something different: Do you have any internet-based topics in your curriculum? Are you looking for something really cool to show them? Really useful? You might find
this information
handy.
Things are Looking up. You can compare weather jet streams
and
gulf streams for more info. What's the difference? There's a Jet Stream in the atmosphere and a Gulf Stream in the ocean. Weather and climate patterns are affected by both of these streams, but in different ways. Also, see and show how the atmosphere is structured vertically.
If you're interested in rain storms, their creation and effects, check out this dew point
article or photos and diagrams of severe weather
if you prefer. It's important to know what the dew point is because it indicates the moisture in the air which affects how clouds and storms form. Finally, you can see forecast map weather techniques for analyzing patterns at higher altitudes in the troposphere; just go to
the upper air analysis
pages.
Do you have any experience with maps and weather? I would like to know. Let us know what you think about this.
Greatest Weather Forecasts
Know a better place for forecasts? Really cool graphics or outstanding weather information?
All weather people like to find new places for unusual data, and here's your chance to help. Feel free to comment; that would be much appreciated. Thank you.
P.S. This is NOT the Weather Network.
What have the other people said about weather?
Scan here to see contributions from previous visitors to this page...

Caribbean jobs in weather 
I need to find Caribbean jobs in weather; what is required to become a meteorologists? for example,degrees in geography, physics, mathematics etc. Lastly, …
Part of Earth That is Not Hit by The Sun Not rated yet
The shape of the Earth is Oblate Spheroid. There is a spot in the northern hemisphere that is not hit by the sun. This is because of the tilt of the Earth. …
Recent Articles
-
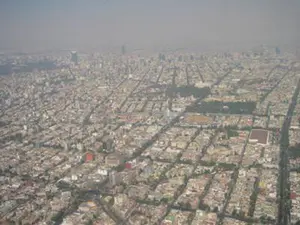
What causes pollution in the outside?
May 12, 26 12:44 AM
 The Hidden World of Pollution - Does the air you breathe have anything to do with a distant volcano or a dusty farm field? There's more to the gray haze
 -
UNDERWEAR AND POLLUTION
May 11, 26 12:12 AM
 Can Underwear Save the Earth? - What if your favorite pair of underwear were the only thing stopping a climate catastrophe? The hilarious truth about farts,
 -
Levi Mays Story about little boys
May 09, 26 07:06 PM
 The Secret History of Hot Air - Ever feel like there's more to what you see on the news? Get your detective gear on because we're diving into a world of
How to Forecast Weather Using a Map?
How useful are those complicated weather maps? Here's an introduction to the forecast map that weather professionals use to prepare your local weather forecast.
Do you have concerns about air pollution in your area??
Perhaps modelling air pollution will provide the answers to your question.
That is what I do on a full-time basis. Find out if it is necessary for your project.
Have your Say...
on the StuffintheAir facebook page
Other topics listed in these guides:
The Stuff-in-the-Air Site Map
And,
Thank you to my research and writing assistants, ChatGPT and WordTune, as well as Wombo and others for the images.
OpenAI's large-scale language generation model (and others provided by Google and Meta), helped generate this text. As soon as draft language is generated, the author reviews, edits, and revises it to their own liking and is responsible for the content.
You are here:
Most Popular Pages on this Website:
Pictures of Global Warming
- See photos, cartoons, charts, graphs and a few surprises.
Clouds
- Don't know a cumulus from a stratus? Check here.
Causes of Global Warming
- It's not always obvious.
Calgary Alberta Weather
- Example of Canadian Goodness.
Thermometers
- Our favourite weather instrument.
- Home
- Contact Us
- Free E-zine Back Issues
- Privacy Policy
- Site Map - I'll help find something good.
By Barry Lough, P.Met., EP (Environmental Professional)
Text copyright © 2003-2024 Stuff in the Air.com
BACK TO TOP - Hit your 'Home' Key
New! Comments
Do you like what you see here? Please let us know in the box below.