- Air Homepage
- Air Quality Modelling Service
- Air Quality Testing
- Natural Gas Leak Detection
Natural Gas Leak Detection: A Practical Guide to LDAR, Quantification and Reporting
Natural gas leak detection can be surprisingly difficult to perform.
The gas may be invisible. The component may be several metres above the ground. A detector reading may tell you that gas is present without telling you how much is escaping. Even after a leak is repaired, someone still has to determine how long it leaked, estimate the emissions and document the result.
That is why a good Leak Detection and Repair (LDAR) program is more than a site inspection.
A useful program connects field detection, component identification, leak classification, repair tracking, emissions quantification and regulatory reporting.
For industrial facilities, natural gas leak detection can also recover valuable information about equipment condition and operating performance. A leak represents potentially lost product as well as an undesirable emissions source.
The Natural gas leak Detection Workflow
A practical LDAR program can be thought of as seven connected steps:
Find → Measure → Classify → Repair → Verify → Quantify → Report
Each step affects the next one.
A detector that finds a leak but does not identify the component creates a maintenance problem. A database that records components but loses repair dates leads to an emissions-estimation problem. An emissions calculation based on poorly documented field data can create a reporting problem.
The objective is therefore to create a defensible chain of information from the equipment in the field to the number eventually reported.
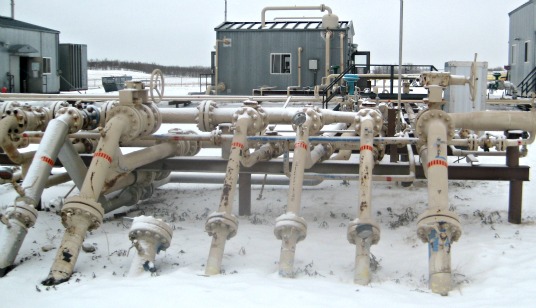
What exactly is being detected? Fugitive emissions are unintended releases from equipment such as:
- valves
- flanges and threaded connections
- connectors
- pressure relief devices
- compressor seals
- regulators
- instrument controllers
- open-ended lines
- pumps and other process equipment
A natural gas leak detection program may encounter everything from a barely detectable screening response to a substantial leak from a compressor seal.
The concentration measured at a component is important, but it is not automatically an emission rate. A reading of 20,000 ppm, for example, does not mean that the component is emitting a particular number of kilograms per hour. The relationship between concentration and emission rate depends on the component type and the applicable quantification methodology.
That distinction becomes important when converting field observations into an emissions inventory.
Two very different tools: OGI and portable gas monitors
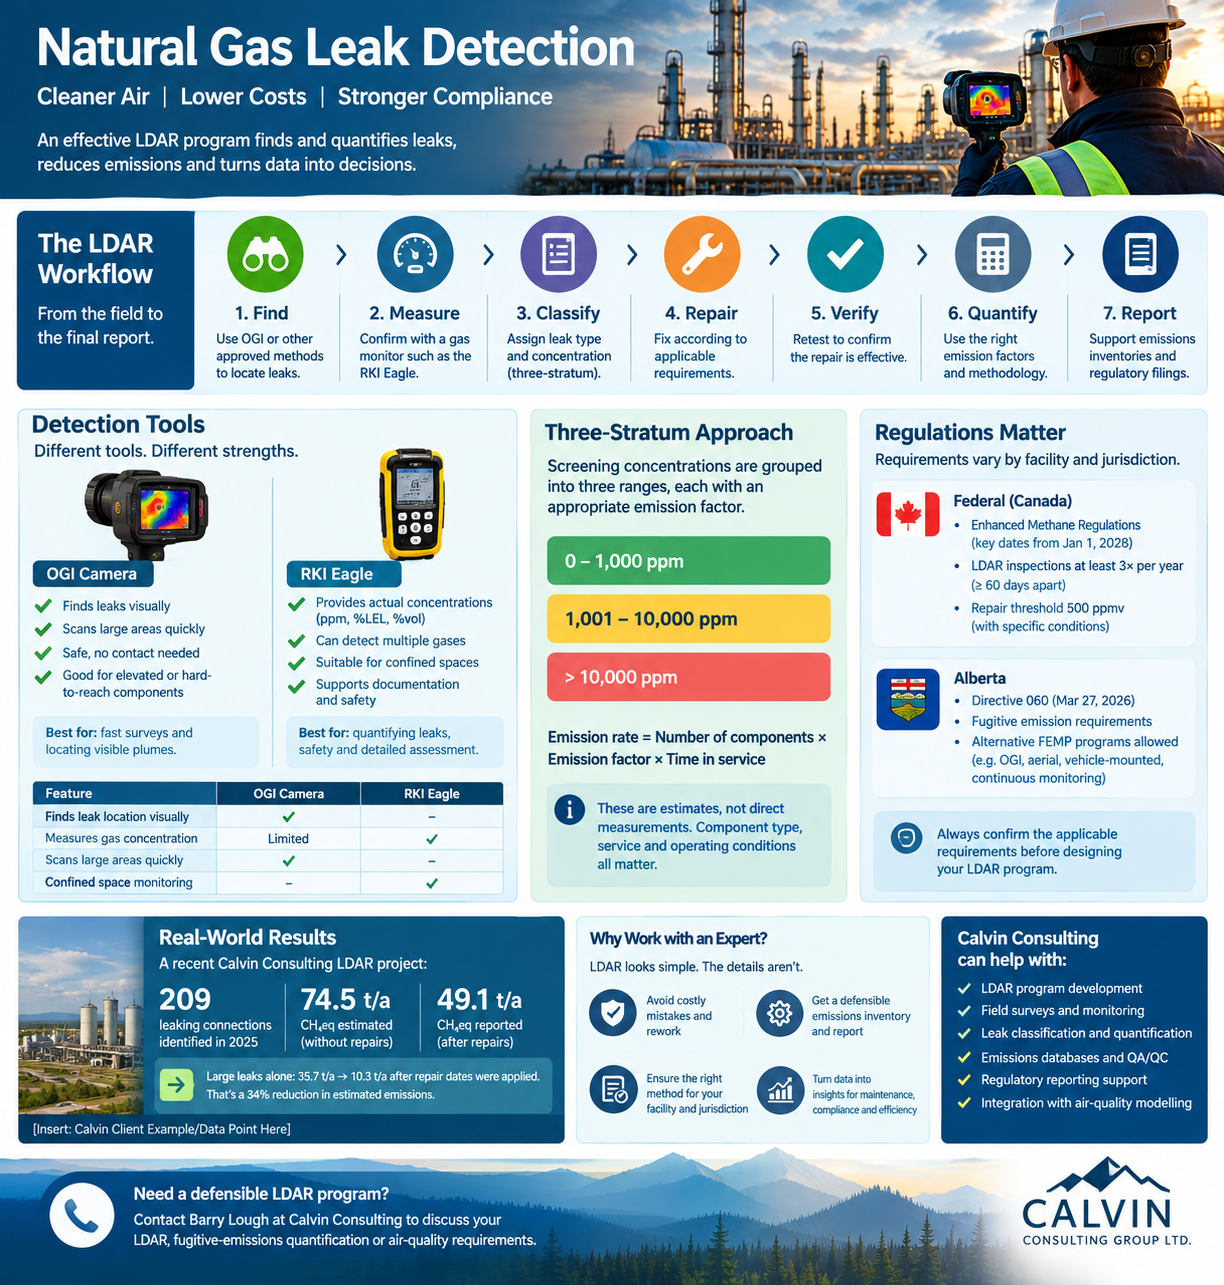
Modern LDAR programs can use several technologies. Two tools illustrate an important distinction particularly well: Optical Gas Imaging (OGI) and a portable pumped gas monitor such as the RKI Eagle.
Optical Gas Imaging
An OGI camera uses infrared radiation to make certain gases visible on a screen. Depending on the camera and filter configuration, OGI systems can be designed for gases such as methane and other hydrocarbons as well as selected compounds including some VOCs.
The great advantage is coverage. An inspector can look across piping, valves and equipment and quickly identify a visible gas plume without physically touching every component. OGI can also be useful where equipment is elevated or difficult to reach.
Typical applications include:
- oil and gas facilities
- gas plants
- compressor stations
- pipelines
- refineries and petrochemical facilities
- landfills and biogas operations
OGI has an important limitation: a conventional camera generally tells you where the leak is, rather than directly measuring its mass emission rate.
Detection performance also depends on factors such as gas type, leak rate, temperature difference, wind and background conditions. Quantitative OGI systems can estimate emission rates, but the result remains dependent on the instrument, setup and operating conditions.
The Alberta Energy Regulator currently recognizes OGI as one of the technologies that can be used for prescribed fugitive-emission surveys. Its alternative FEMP guidance specifies performance criteria for approved OGI applications and also allows equivalent technologies to be proposed.
Portable gas monitors
Calvin Consulting has used RKI Eagle instruments for fugitive-emission screening.
The RKI Eagle draws an air sample into the instrument through an internal pump, hose or probe. Sensors then provide numerical measurements such as ppm, %LEL or % volume depending on the instrument configuration. This makes it fundamentally different from an OGI camera.
Capability
OGI camera
RKI Eagle or similar monitor
Locates leaks visually
Yes
No
Provides numerical concentration
Generally limited
Yes
Surveys large areas quickly
Yes
More limited
Samples through tubing
No
Yes
Useful for confined-space gas monitoring
Limited
Yes
Stand-off inspection
Yes
Limited by sampling arrangement
Provides direct emission rate
Generally no
No
Supports component-level screening
Yes
Yes
The two technologies can therefore complement each other. An OGI camera can rapidly locate a plume. A portable monitor can then provide a numerical concentration measurement at the component.
The best instrument is determined by the question the survey needs to answer, the regulatory program and the facility itself.
Natural gas leak detection is an instrumentation problem as much as an inspection problem. Choosing equipment without considering what information the resulting data must support can create unnecessary cost or leave important information missing.
The three-stratum approach
One of the methods used for fugitive-emission quantification divides detected leaks into three concentration ranges:
- 0–1,000 ppm
- 1,001–10,000 ppm
- greater than 10,000 ppm
The Alberta Energy Regulator's Manual 015 describes this as the three-stratum emission-rate method and uses it as one of the approaches available for estimating fugitive emissions.
The important point is that the strata are screening categories. They are not three direct measurements of emission rate.
A leak from a connector and a leak from a compressor seal can produce very different emission rates even when their screening concentrations fall into the same stratum. The applicable emission factor therefore depends on the component type and service.
A simplified calculation looks like this:
Number of leaking components × applicable emission factor × time in service
= estimated emissions
The real calculation can be considerably more complicated because component type, service, operating time, repair date and other factors may need to be considered. This is where a database becomes much more useful than a stack of field forms.
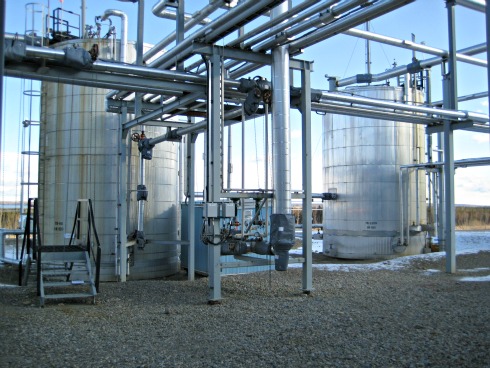
From a field reading to an emissions estimate
Consider what has to happen after an inspector finds a leak. The program needs to know:
- What component is leaking?
- Where is it located?
- What type of component is it?
- What service is it in?
- What concentration was measured?
- When was the leak identified?
- Was it repaired?
- When was it repaired?
- How should its emissions be quantified?
- Where does the resulting number need to be reported?
Lose any of those connections and the final estimate becomes harder to defend. This is one reason Calvin Consulting developed an Emissions Quantification Database for LDAR work. Field information can be associated with individual component codes and then used for emissions calculations and reporting.
The approach also allows repair dates to be incorporated where the methodology permits it.
A real example
A recent Calvin Consulting LDAR and fugitive-emissions quantification project illustrates why this matters. During the 2025 survey, 209 leaking connections were identified:
Leak classification
Number identified
Large
42
Medium
74
Small
93
Total
209
The project's quantification initially estimated approximately 74.5 tonnes per year of CH₄ equivalent if applicable repairs were not taken into account.
After repair dates for large leaks were incorporated, the reported estimate was approximately 49.1 tonnes per year of CH₄ equivalent. That is a difference of about 34% in the estimated annual emissions for the reported scenario.
The large leaks illustrate the effect particularly clearly. Before accounting for repair dates, they represented an estimated 35.7 tonnes per year. After the applicable repair dates were incorporated, the estimate was 10.3 tonnes per year.
The calculation did not simply assume that every detected leak continued for the entire year.
This is the kind of information that turns an LDAR survey from a list of detector readings into a useful emissions-management tool.
Why repair dates matter
Imagine that a significant leak is detected in November and repaired in December. Treating that leak as though it continued throughout the entire year would overstate the emissions attributable to that component.
Conversely, assuming that every leak was repaired immediately would understate emissions. A defensible calculation needs to reflect what actually happened, where the applicable methodology allows that level of refinement.
Calvin's project reports can therefore distinguish between:
- the emissions estimated before repair
- the date the leak was identified
- the date it was repaired
- the resulting emissions attributable to the applicable reporting period
That distinction can become particularly important for large leaks.
Detection concentration is not the same thing as emission rate
This is one of the easiest concepts to misunderstand. Suppose an instrument records: 25,000 ppm methane
That number describes the concentration measured by the instrument under the test conditions. It does not automatically mean: 25,000 ppm = X kg/h
The emission-rate estimate requires additional information about the component and the methodology being applied.
The Alberta Manual 015 three-stratum method, for example, assigns emission rates according to leak stratum, component type and service. This is also why published emission factors need to be applied carefully.
A component-specific factor is an empirical estimate. It carries uncertainty. Two facilities can have different operating conditions even when they contain the same nominal component.
An experienced practitioner therefore keeps track of the difference between: what the instrument measured and what the emissions model estimates from that measurement.
That distinction is central to defensible natural gas leak detection and reporting.
What happens to the data?
A useful LDAR database should do more than produce a total emissions number. The same field information can support:
- annual emissions reporting
- methane reporting
- GHG inventories
- fugitive-emissions inventories
- repair tracking
- maintenance planning
- identification of recurring problem equipment
- quality assurance
- trend analysis between surveys
- investigation of unusual emission sources
For example, repeated leaks at a particular type of valve may point toward an equipment or maintenance issue. A cluster of leaks around one process unit may justify closer investigation. A large estimated emission from a compressor seal may deserve a very different response from several tiny connector readings.
A leak detector produces a number. An LDAR program produces information you can act on.
Alberta and federal requirements are different
Regulatory requirements need to be checked against the facility, jurisdiction and applicable program.
In Alberta, the current Directive 060: Upstream Petroleum Industry Flaring, Incinerating, and Venting was released in 2026. It establishes requirements for flaring, incinerating and venting at applicable upstream petroleum facilities and includes requirements related to fugitive-emission screening.
The AER also permits alternative Fugitive Emission Management Programs under defined conditions. These can use technologies such as OGI, aerial methane sensors, vehicle-mounted sensors or continuous monitoring where the required performance and equivalency provisions are met.
Federal requirements are a separate consideration. The 2025 Enhanced Methane Regulations apply to specified onshore oil and gas production, processing and transmission activities. The enhanced requirements strengthen LDAR and venting controls, with key compliance dates beginning in 2028.
For facilities subject to the federal LDAR requirements described in current federal guidance, equipment components generally must be inspected at least three times per year with at least 60 days between inspections. The federal program also establishes repair requirements for measured leaks at or above 500 ppmv, with provisions for repair during a subsequent planned shutdown under specified circumstances.
Alternative federal LDAR programs are also possible where equivalency in fugitive-emission reductions is demonstrated.
The practical lesson is simple: do not build an LDAR program around a generic deadline found on an old webpage.
The applicable regulatory framework should be established before the survey design is finalized.
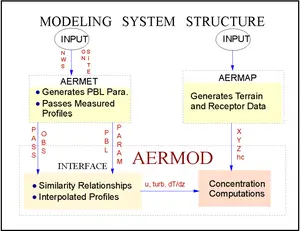
LDAR is different from air-quality modelling
LDAR and air-quality dispersion modelling can work together, but they answer different questions.
Question
LDAR
Dispersion modelling
Is gas escaping from equipment?
Yes
No
Where is the source?
Yes
Requires source information
What concentration was detected near the component?
Yes
Predicts concentrations mathematically
How much is being emitted?
Estimates using applicable methods
Uses an emission rate as an input
Where might emissions travel?
Limited
Yes
What could concentrations be at receptors?
No
Yes
Can it evaluate cumulative ambient effects?
No
Yes
LDAR provides information about the source. Dispersion modelling can use source information to estimate how emissions behave in the atmosphere.
For facilities where fugitive emissions are important to an air-quality assessment, keeping those two pieces of work consistent can prevent major errors.
Why professional LDAR work can save money
The apparent cost of an LDAR program is easy to see. The less obvious cost is getting the program wrong. A poorly designed survey can lead to:
- incomplete component coverage
- unusable historical comparisons
- inconsistent leak classifications
- incorrect emissions factors
- missing repair dates
- duplicated components
- difficult regulatory reporting
- unnecessary repeat fieldwork
Professional involvement is particularly valuable when the LDAR data must support several regulatory programs at once.
Calvin Consulting can develop or review an LDAR Quality Assurance Plan, establish component inventories, select appropriate field methods, manage survey data, perform emissions quantification and prepare reporting documentation.
The goal is a defensible information trail from the physical equipment to the final emissions number. That is where the economics become clearer.
Paying for an experienced professional at the beginning can be considerably less expensive than discovering later that thousands of field measurements cannot be reconciled with the component inventory or regulatory reporting requirements.
What Calvin Consulting can do
Calvin Consulting's LDAR work can include:
- LDAR program and Quality Assurance Plan development
- facility component inventories
- field survey planning
- Method 21-style portable monitoring
- OGI program evaluation
- leak classification
- repair tracking
- emissions quantification
- three-stratum calculations
- emissions databases
- QA/QC review
- regulatory reporting support
- interpretation of fugitive-emission data
- integration of LDAR results with broader air-quality assessments
The work can be structured around the facility's actual needs rather than collecting data simply because the technology makes it possible. For operators, environmental coordinators and engineers, the important question is often not whether a leak can be detected.
It is whether the resulting information will still make sense six months later when someone has to explain where the number came from.
Need a defensible LDAR program?
Calvin Consulting can help determine what needs to be measured, how it should be documented and how the resulting data should be converted into emissions estimates and regulatory information.
For natural gas leak detection, the instrument is only the beginning. The real value comes from designing a survey that produces reliable information all the way from the component in the field to the number in the report.
Contact Barry Lough at Calvin Consulting to discuss your LDAR, fugitive-emissions quantification or air-quality requirements.

Go back from Natural Gas Leak Detection to the Air Quality Testers webpage or back to the Stuff in the Air homepage
Search this site for more information now.
Recent Articles


-
Aermod Model and Environmental Breakthroughs.
Oct 09, 26 10:28 PM
 How the aermod model uses terrain and meteorological analysis (AERMAP and AERMET) to predict pollutant spread, and how ISC3 fails to do so.
-
Gas Flare Output SO2 – How to control it.
Oct 04, 26 06:37 PM
 What's the best way to handle temporary flaring and its output SO2? In Directive 60, the Alberta Energy Regulator (AER) gives guidance.
-
Natural Gas Leak Detection: Does YOUR Facility Need it?
Sep 28, 26 08:40 AM
 It's important for industries, especially in the energy sector, to have a natural gas leak detection program. It's often required by law.

Designing a survey
A good survey begins before anyone walks onto the site. The program should establish:
1. What equipment is included? Create or verify the component inventory.
2. What detection method is appropriate? Method 21-style portable monitoring, OGI or another approved or equivalent technology may have different advantages depending on the program.
U.S. EPA Method 21 provides a standardized approach for determining volatile organic compound leaks using portable monitoring equipment.
3. How will components be identified? Unique component codes make repeated surveys much easier to compare.
4. How will results be recorded? A useful field record should connect the instrument reading with the actual physical component.
5. How will repairs be tracked? Detection and repair need to remain connected in the database.
6. How will emissions be quantified? The methodology should be established before the results are being assembled.
7. What reports must receive the information? The final data may feed several different regulatory or corporate reporting systems.
This front-end planning is where much of the value of professional LDAR work is created.
Do you have concerns about air pollution in your area??
Perhaps modelling air pollution will provide the answers to your question.
That is what I do on a full-time basis. Find out if it is necessary for your project.
Have your Say...
on the StuffintheAir facebook page
Other topics listed in these guides:
The Stuff-in-the-Air Site Map
And,
Thank you to my research and writing assistants, and the author remains responsible for the content.
What experienced LDAR practitioners notice
The biggest reading on an instrument is not automatically the most important piece of information.
- A 50,000 ppm reading from a small connector and a 50,000 ppm reading from a compressor seal are very different emissions sources.
- A leak that is difficult to access may require a different inspection strategy from one at ground level.
- A detector response can also be affected by sampling position, wind, background concentration, instrument condition and calibration.
- The field technician therefore needs to understand the equipment being tested.
- The data analyst needs to understand how those observations become emission estimates.
- The person preparing the regulatory report needs to understand what the applicable reporting system actually requires.
Those are different skills that happen to meet in the same LDAR project.

By Barry Lough, P.Met., EP (Environmental Professional)
Text copyright © 2003-2026 Stuff in the Air.com
BACK TO TOP - Hit your 'Home' Key