- Air Homepage
- Radar
- Doppler Weather Radar
Doppler Radar Weather: Discover the Magic of Air-Information Like Never Before!
See a bit about Doppler radar weather. This link and the text below give you a summary. It's a bit technical, so we'll look at the instrumentation used in a typical radar station.
Doppler Radar Finds Tornadoes: The Sound of Storms - If you can hear a siren change pitch as it speeds past, you already understand Doppler radar's power to find rotating storms. Check out how a tiny shift in a radio wave can pinpoint the exact location and speed of the winds heading your way.
How is Doppler different from conventional radar?
Careful, you might become fascinated by this technology. Doppler radar is great for weather forecasting and storm tracking. Detects motion of objects, providing wind speed and direction in real-time.
At the bottom of this page, I'll provide you a chance to see real live Doppler weather information.

By the way, this is commonly misspelled doplar radar weather or dopler radar weather as well. Let's compare.
Conventional radar detects the presence of dense objects (such as precipitation) in the field, while the Doppler system detects a phase shift between the outgoing and incoming signals.
This shift is officially known as the Doppler Shift similar to that used to identify velocities of stars. Most of us are familiar with the downward pitch-bend of a siren's wail as the ambulance speeds by you.
Imagine that vehicle is at the center of the smallest ring in the sketch above and speeding to the right.
The spaces between the curves on the right are much smaller than
those on the left. This schematically represents the Doppler shift.
Person C hears a higher pitch, smaller sound wavelengths, than Person
A. Person B is somewhere between. Actually, if I were Person C, I
would be running to get out of the way and not worrying about the sound
too much.
Doppler radar weather equipment
The electronics in the Doppler radar weather observing unit can track and find the correct way to interpret the shift. Then we can tell if the object is moving towards the radar station or away from it, and how fast.
Bear in mind, though, it cannot detect any lateral movement, any motion towards to the left and right when viewed from the radar.
It cannot tell the difference between a lateral wind and no wind
at all. You need a person to look at the animated figures for that.
It is this capability that enables Doppler radar users to identify rotating
areas and twisters. As well as mesocyclone signatures giving the
possibility
of vortex tornadoes.
Creating radar images
As with any radar, the Doppler radar weather receiver picks up a tiny fraction of the transmitted power. Energy in the form of shock waves of information which go out and then return. But this time it notices a small phase shift.
If all the countless little bits of information are plotted on a
graph called an electromagnetic spectrum chart, we get a curve. This
distribution curve can show the perceived velocity and turbulence. But
the ambiguity naturally increases with range, or distance from the radar
A computer program may be used to skip the graph and colour-code the
output for atmosphere diagrams instead. A table of colors, called a
Velocity-Azimuth Display (VAD) appears on the right side of the example
below. It helps the user interpret these values and the images. Like this:
 From Environment Canada maps
Velocity radar - Doppler limitations
Usually the detection equipment in a Doppler radar set-up has a smaller range than other radar stations.

That is because a lower pulse frequency (and greater range) would limit the range of distinct velocities, the Nyquist interval, too much to be useful.
You would often use Doppler Radar weather detection equipment to observe higher wind speeds than ordinary radar can handle. There is a lot of math involved here.
#7
Outlook: Severe weather ahead
What is the data used for? Horizontal wind, usually. That's what we're mainly concerned with, but the radar can be configured for analysis of vertical winds as well.
The wind blows faster at higher atmosphere levels, so a display that
shows various altitudes will reveal this fact. Also if there is nothing
dense to reflect the signal, such as rain, we collect no wind or cloud
information from the radar.
Operators learn to recognize patterns in the Doppler radar weather display.
Then scientists combine the patterns with data from additional sources such as
1 - satellites
2 - air prediction models
3 - observations
4 - their own personal understanding of meteorological processes
...to make sense of the whole picture.
After learning to read a wind field, we then figure out how to pinpoint
Doppler radar anomalies and identify deviations from a uniform wind. We
also find convection examples such as
- tornadoes
- other rotation
- divergence / convergence areas
- distinct bulls-eye patterns
- theoretical "D" patterns
...embedded in a constant flow.
It even gets better when these effects are combined and occur at a
remote distance. Doppler radar weather meteorologists and technicians require intense
training to make accurate interpretations of their imagery.
Current Doppler Radar
Click the image of your choice:
United States
Canada
Europe (Centred on Spain; you can pan to adjacent countries)
Europe (Centred on Germany)
Go back from Doppler Radar Weather to Radar Real Time Weather now.
Recent Articles
-
methane air pollution
May 16, 26 02:20 AM
 Methane is the secret smog maker - Gas from farm animals and garbage dumps can turn a blue sky into a brown soup? It turns out methane gas is linked to
 -
Global Warming Klan
May 15, 26 12:57 AM
 Planet Rescue: Real Action or Total Chaos? - Some people are so worried about the world that they come up with some pretty crazy ideas. Discover how kids
 -
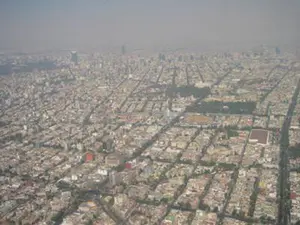
What causes pollution in the outside?
May 12, 26 12:44 AM
 The Hidden World of Pollution - Does the air you breathe have anything to do with a distant volcano or a dusty farm field? There's more to the gray haze
What is so special about Doppler Radar Weather?
In Doppler radar weather pictures, we are able to see air information that is not available in other media. What is the process?
Do you have concerns about air pollution in your area??
Perhaps modelling air pollution will provide the answers to your question.
That is what I do on a full-time basis. Find out if it is necessary for your project.
Have your Say...
on the StuffintheAir facebook page
Other topics listed in these guides:
The Stuff-in-the-Air Site Map
And,
Thank you to my research and writing assistants, ChatGPT and WordTune, as well as Wombo and others for the images.
OpenAI's large-scale language generation model (and others provided by Google and Meta), helped generate this text. As soon as draft language is generated, the author reviews, edits, and revises it to their own liking and is responsible for the content.
You are here:
Most Popular Pages on this Website:
Pictures of Global Warming
- See photos, cartoons, charts, graphs and a few surprises.
Clouds
- Don't know a cumulus from a stratus? Check here.
Causes of Global Warming
- It's not always obvious.
Calgary Alberta Weather
- Example of Canadian Goodness.
Thermometers
- Our favourite weather instrument.
- Home
- Contact Us
- Free E-zine Back Issues
- Privacy Policy
- Site Map - I'll help find something good.
By Barry Lough, P.Met., EP (Environmental Professional)
Text copyright © 2003-2024 Stuff in the Air.com
BACK TO TOP - Hit your 'Home' Key
New! Comments
Do you like what you see here? Please let us know in the box below.