- Air Homepage
- Weather Equipment
- Thermometer Pictures
Temperature Insights and Thermometer Pictures: Unique Designs!
There are times when TV news shows thermometer pictures or temperature displays in the corner of the screen, during your weather and sports broadcast. Looks like this one on the left.

A Guide to Thermometers and Scales: The Science of Hot and Cold - Are you really sure what those numbers on your weather app - or even the thermometer on your wall - mean? Discover why water freezes at 32°F and 0°C simultaneously, and how everything from bimetal strips to floating glass balls can measure heat flow!
Why? People usually care about the temperature in the weather report. How warm it is now or will be soon.
You're probably interested in weather and temperatures and might track the temperature on apps to figure out when it's best to go outside. This information can also help you plan your activities.
Most television thermometers display just one value, but real indoor and outdoor thermometers have more. This picture usually shows two of the three scales.

Which one is Fahrenheit? It ranges from a cool 60 degrees (°F) to a warm 75 degrees or more on the third temperature scale on the right. A day below 50 is pretty cold; water freezes at 32.
Temperatures over 80 are usually considered hot, while water boils at 212. The drawing has more examples of simple conversions. By the way...
To convert Fahrenheit to Celsius, add 40, divide by 9, multiply by 5, and subtract 40. Easy.
What is Celsius?
The second temperature scale is marked with a capital C at the top. The same comfortable outdoor temperatures are now expressed as cool 15 degrees (°C) to warm 24 degrees (°C). At zero, water freezes, and below 10 is a blast of cold air.
Many regions consider 27°C hot weather, and 100°C is the boiling point of water. Since the Celsius scale freezes at zero and boils at 100, it's also called centigrade, where centi means hundred.
I've included two lighthearted but scientific articles that give you a lot of information on the history and development of temperature scales. There are nearly a dozen different scales mentioned.
To recap, the most common temperature scales are
-Celsius scale: Also known as the centigrade scale, it's a metric temperature scale. Water's freezing point is 0°C, and its boiling point is 100°C at standard atmospheric pressure.
-Fahrenheit scale: It's a temperature scale developed in the early 18th century that's mostly used in the U.S. and the Caribbean. Water's freezing point is 32°F, and its boiling point is 212°F.
-Kelvin scale: It's an absolute temperature scale used in science. This scale starts at absolute zero (-273.15°C), the temperature at which molecular motion stops. Kelvin degrees are the same size as Celsius degrees.
-The Rankine scale is a temperature scale used mostly in engineering, especially in the US. The zero point is set at absolute zero in Fahrenheit degrees (-459.67°F), making it absolute like the Kelvin scale.
-The Réaumur scale is mostly used in Europe. At standard atmospheric pressure, water's boiling point is 80°Ré and its freezing point is 0°Ré.
-Delisle scale: It's a Russian temperature scale named after its inventor, Joseph-Nicolas Delisle. This scale sets water's freezing point at 0°D and its boiling point at 150°D.
- Developed by Sir Isaac Newton in 1701, the Newton scale isn't used much anymore. At standard atmospheric pressure, the freezing point of water is 0°N, and the boiling point is 33°N.
More about temperature
The far left scale on the thermometer picture above (with a K) is simply the Celsius temperature plus 273 or so. Known as the Kelvin scale, it's based on the fact that absolute zero, the coldest temperature possible, is roughly equal to –273.15 on the centigrade scale. Rankine (mentioned above) is another absolute scale, and it's just degrees Fahrenheit plus 459.67.
Here is a technical definition meteorology people use for temperature: Temperature determines a body's ability to transfer heat or receive heat from other bodies.
Heat flows "downhill" in relation to temperature. The more the temperature difference, the steeper the hill and the faster the heat flows from the warmer object to the cooler one. Do you want to know more about the weather and temperature?
1) See how meteorologists use upper air temperatures in the preparations of weather forecasts a ground-level. Air temperatures at different heights in the atmosphere can tell you how much energy is available in the atmosphere to fuel storms, as they provide a critical insight into atmospheric conditions that can change the weather.
2) What is most like to cause temperature to suddenly change? The movement of air masses, weather systems like thunderstorms or precipitation and other dynamics of the atmosphere.
3) What's one special name for an unusually warm period in the middle of winter? Hint: it's named after the month when it happens most often.
Here's how to get the best readings from your own thermometer: The location is important. Sunlight heats the thermometer, and nearby buildings can also heat it. Direct sunlight causes falsely-high temperature readings in both cases.
 Measurements for Success
Even a few feet above ground at eye level, the ground can be several degrees colder at night than the air. Meteorologists use standards to make sure they're consistent. In order to get official readings, technicians install temperature recorders on the north side of a building, but not too close, or north of a tree about six feet away.
Even better...The thermometers and other meteorological instruments are housed in a Stephenson Screen. Weather instruments like thermometers, barometers, and hygrometers are protected by Stephenson Screens from external factors like direct sunlight, precipitation, and wind that could affect their readings.
It's usually made of wood and has a double-louvered design that lets air flow freely through it while still shading and protecting the instruments inside. The idea: provide a stable and consistent environment for weather instruments to operate in, so you can collect and analyze accurate data.
Different Kinds of Thermometer pictures:
Infrared thermometers and digital remote thermometers are used for special applications.
#11
Combinations like thermometers with humidity displays or outdoor clocks and thermometers are great for enhancing your home and garden. The most common thermometer pictures show one with a glass bulb filled with liquid (like mercury ether or alcohol), which expands and rises into a vertical tube marked with a scale showing the temperature in °F or °C.

Occasionally, you'll see a thermometer picture with a special apparatus like this one on the right.
These temperature-humidity data loggers use electronic temperature sensors as resistors in electrical circuits. As the temperature changes, this component's electrical resistance changes.
I'll give you an unusual example. One Christmas, my wife gave me a Galileo Thermometer. The glass balls don't change size, but the liquid they float in gets lighter as it warms. When it warms up, they slowly drop. Click on the photo for a fuller explanation.

It is also possible to use a bimetal strip thermometer, which is a clever device.

Indoor thermometers and garden thermometers like this one on the right use this type of sensor mechanism, which is also found in some household thermostats. Heat expands all metals, but at different rates.
Manufacturers stick two strips of metal together and make a coil out of them. One of the metals expands faster than the other when it gets hot, making the loop tighter.
So it curls even more. This apparatus could have a needle attached with a visible scale so the needle points to the right temperature, just like they did in the photo.
What do you think about thermometers?
Show us your stuff.
Got a great photo? Or a drawing? Undeniable evidence of global warming to make your point? Here's a chance to post it and let others see.
You can rant below instead. Is Global Warming dead? Worse?
See other good shots here.
Click below to see contributions from other visitors to this page. Check back once-in-a-while to watch the collection grow.

Thermometer 
Have a look at this old photograph. Approximately five years before he passed away, this famous scientist created this artwork.
Barry's Response …
Global Warming--Man-caused or Natural Cycle? Not rated yet
Global warming is demonstrably true; however, while man's activities undoubtedly contribute to it, just how much is debatable. The rise in CO2 in some …
Recent Articles
-
the sun
May 17, 26 07:26 PM
 Cosmic Midlife Crisis: - Is the Sun Melting the Earth? Are you worried that the giant burning star in our sky is melting the Earth? Global warming isn't
 -
methane air pollution
May 16, 26 02:20 AM
 Methane is the secret smog maker - Gas from farm animals and garbage dumps can turn a blue sky into a brown soup? It turns out methane gas is linked to
 -
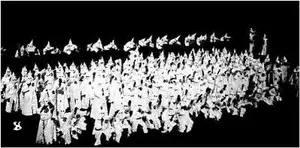
Global Warming Klan
May 15, 26 12:57 AM
 Planet Rescue: Real Action or Total Chaos? - Some people are so worried about the world that they come up with some pretty crazy ideas. Discover how kids

Pictures of thermometers: Can YOU determine the temperature?
Learn about: temperatures by viewing different thermometer pictures. Designs and combinations that are unique. Scientific usage of thermometers.
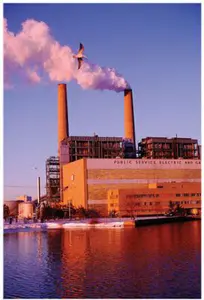
Do you have concerns about air pollution in your area??
Perhaps modelling air pollution will provide the answers to your question.
That is what I do on a full-time basis. Find out if it is necessary for your project.
Have your Say...
on the StuffintheAir facebook page
Other topics listed in these guides:
The Stuff-in-the-Air Site Map
And,
Thank you to my research and writing assistants, and the author remains responsible for the content.
You are here:
Most Popular Pages on this Website:
Pictures of Global Warming
- See photos, cartoons, charts, graphs and a few surprises.
Clouds
- Don't know a cumulus from a stratus? Check here.
Causes of Global Warming
- It's not always obvious.
Calgary Alberta Weather
- Example of Canadian Goodness.
Thermometers
- Our favourite weather instrument.
- Home
- Contact Us
- Free E-zine Back Issues
- Privacy Policy
- Site Map - I'll help find something good.
By Barry Lough, P.Met., EP (Environmental Professional)
Text copyright © 2003-2024 Stuff in the Air.com
BACK TO TOP - Hit your 'Home' Key