- Air Homepage
- Air Quality Modelling Service
- Air Quality Dispersion Modelling
- Air Quality Particulate Matter
Air Quality Particulate Matter: How PM Is Represented in Dispersion Modelling
Why PM₂.₅ and PM₁₀ are more complicated than the number on the air quality particulate matter report
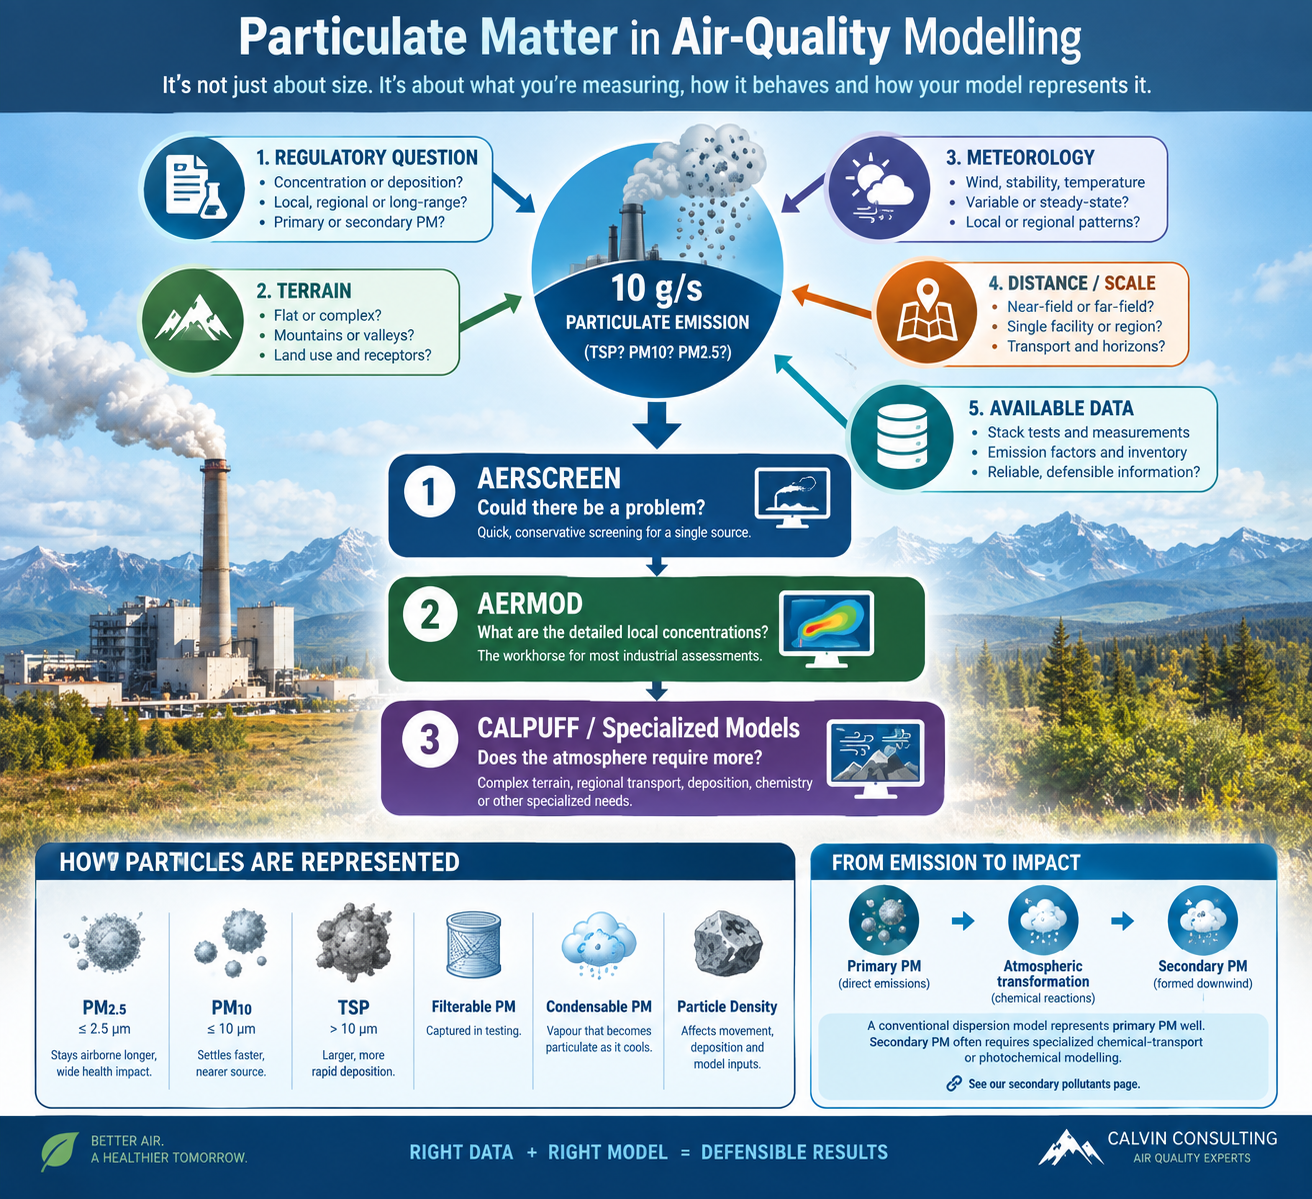
A facility report says it emits 10 g/s of particulate matter. That sounds precise.
It isn't enough information to build a good dispersion model. Is the 10 g/s:
- total suspended particulate matter (TSP)?
- PM₁₀?
- PM₂.₅?
- filterable particulate?
- filterable plus condensable particulate?
- a measured emission?
- an emission factor?
- a permitted maximum?
- a typical operating rate?
What size are the particles? How dense are they? Do they settle rapidly or remain airborne? And are we modelling concentration, deposition or both?
These questions are why Air quality particulate matter modelling is about much more than entering one emission rate into AERMOD or CALPUFF.
The number is only the beginning. The modeller has to understand what the number actually represents.
What is air quality particulate matter?
Particulate matter, or PM, is a mixture of solid particles and liquid droplets suspended in the atmosphere.
For dispersion modelling, the most familiar categories are:
- PM₂.₅ - Particles with an aerodynamic diameter of approximately 2.5 micrometres or less.
- PM₁₀ - Particles with an aerodynamic diameter of approximately 10 micrometres or less.
- TSP - A broader particulate category containing smaller particles as well as larger particles and is sometimes known as TPM (total particulate matter).
The categories overlap. PM₂.₅ is part of PM₁₀ and PM₁₀ is part of the broader particulate inventory. That means a report containing: TSP = 10 g/s does not mean: PM₂.₅ = 10 g/s.
The modeller needs to know how the total mass is distributed among the particle-size categories.
This is one of the most important concepts in air quality particulate matter modelling.
A particle is not just a particle
Two particles can have the same geometric diameter and behave differently in the atmosphere.
Why? Because physical properties matter. Among the most important are:
- Particle size
- Particle density
- Mass fraction
- Aerodynamic properties
These affect how particles move, settle and deposit. A very fine particle can remain airborne for a long time. A larger, denser particle may settle more quickly.
That difference can be relatively unimportant when the only question is a short-range concentration near a source, but it becomes increasingly important when particulate deposition is part of the assessment.
So the modeller needs to know what the particles actually are rather than simply what the facility calls them.
What was actually measured?
Before using a particulate emission rate, one of the first questions we ask is: What exactly did the measurement measure?
This is especially important when working with stack-testing data. A stack test may distinguish between:
Filterable particulate - Material collected directly as particulate during the sampling process. Note that particulate matter from wet cooling towers is generally treated as filterable PM resulting from drift droplets and their dissolved solids.
Condensable particulate - Material emitted as vapour that can condense into particulate as the exhaust cools. That distinction can be important.
A source may have a relatively modest filterable PM emission while releasing a much larger condensable fraction. Veneer dryers are a classic example. BC's dispersion-modelling guidance specifically discusses condensable particulate and recognizes that the condensable fraction can be important for some sources.
This is one reason a stack-test number should never be copied into the model without understanding what the test actually measured.
The atmosphere doesn't care what box the laboratory put the emission into. It matters what actually leaves the source and what happens to it afterward.
Filterable and condensable PM: a simple example
Imagine two sources that each report: 5 g/s of filterable PM.
- Source A has very little condensable material.
- Source B has another 5 g/s of condensable material.
They don't represent the same atmospheric emission. Source A may reasonably be represented using approximately 5 g/s.
Source B may need substantially more total particulate considered, depending on the applicable measurement method and modelling guidance.
This is why air quality particulate matter assessments need to distinguish the measured fraction from the total material that could contribute to the ambient particulate concentration.
Where do particulate emission estimates come from?
There is no single source of the right number. Depending on the facility, emissions can be developed from:
- stack testing;
- continuous monitoring;
- manufacturer information;
- approved emission limits;
- emission factors;
- engineering calculations;
- facility operating data; and
- industry-specific emission estimation methods.
For existing facilities, we often compare several sources of information rather than relying on one document. For example, Calvin Consulting may compare:
- recent AEIR submissions with
- historical AEIR information and
- NPRI data and
- AER licence or approval information and
- stack-testing results and
- current (or design) facility information.
If the numbers differ, the answer is not automatically to pick the largest one. First ask: Why are they different?
- Production may have changed.
- Equipment may have changed.
- A permit limit may have changed.
- The reporting basis may have changed.
- A control device may have been installed.
- Or one of the numbers may simply be wrong.
That kind of reconciliation is often more valuable than another decimal place in the model output.
Alberta's emission inventory is a useful modelling resource
For Alberta projects, the Annual Emissions Inventory Report (AEIR) Standard and Guidance document provides industry-specific information that can be extremely useful when developing particulate inputs.
The AEIR framework includes information organized by sector and equipment and provides guidance on emissions reporting and associated emission characteristics.
One particularly useful feature is the industry-specific information on typical particulate-size distributions.
At Calvin, we consult that information frequently. It can provide a better starting point for estimating the PM₂.₅ and PM₁₀ fractions of an emission than simply guessing at a particle-size distribution.
The important word is starting point. A source-specific stack test or other reliable facility information may provide better data for a particular project.
 Particle density calculations
Particle-size distributions: where the model gets more detailed
A dispersion model does not necessarily treat all particulate mass as one giant cloud of PM. Instead, the particulate can be represented by a series of particle-size categories.
For AERMOD, the modeller can specify particle information through size, mass fraction, density and emission rate inputs. For CALPUFF, particulate species can similarly be represented using particle-size information appropriate to the selected modelling and deposition approach.
BC's guideline, for example, specifies a series of PM species with defined size ranges and geometric mean diameters for PM₂.₅ and PM₁₀ deposition calculations.
This may look unnecessarily complicated. It isn't. The model is trying to answer a physical question: How does this particular mixture of particles behave in the atmosphere?
An Alberta example: turning TSP into PM₂.₅ and PM₁₀
Trade secret: Suppose a source emits: 10 g/s of TSP.
Assume an applicable industry-specific emission methodology indicates: PM₂.₅/TSP = 0.560 and PM₁₀/TSP = 0.737.
The corresponding mass rates would be approximately:
- PM₂.₅ = 5.60 g/s
- PM₁₀ = 7.37 g/s
Those values are not automatically universal values for the industry. They are an example of how a reported TSP emission can be converted into size-specific fractions using an appropriate source methodology.
 Mighty fine particulate matter
The next step is to distribute that particulate mass among the particle-size categories required by the selected model. This is where air quality particulate matter modelling moves from a simple emissions inventory to actual source characterization.
Why particle density matters
Imagine two particles with exactly the same diameter. One is a light carbonaceous particle. The other is a dense mineral particle.
Their aerodynamic behaviour can be different. This matters particularly when deposition is being modelled.
A default particle density can be useful when no better information is available, but it shouldn't automatically override reliable source-specific information. This can be important for industries such as:
- mining;
- aggregate production;
- concrete production;
- material handling; and
- stockpiling.
For example, hard-rock dust is not necessarily well represented by assumptions developed for a different type of particulate source. A default is an input assumption, not a statement about what the particles are actually made of.
AERMOD and particulate matter
AERMOD is widely used for particulate dispersion modelling and can represent particle deposition using information such as particle diameter, mass fraction and density.
For many routine industrial assessments, it provides everything required to predict ground-level particulate concentrations. That is one reason AERMOD is our normal starting point at Calvin.
The key is to provide the model with a defensible description of the source. The same emission rate can produce different predictions if the source's particle properties, release conditions or operating characteristics are represented differently.
For air quality particulate matter modelling, good source characterization is therefore at least as important as the choice of software.
CALPUFF and particulate matter
CALPUFF can also represent particulate emissions, including size-dependent deposition and other regional-scale processes. Its additional capabilities can become useful when the assessment involves:
- longer-range transport;
- complex terrain;
- spatially varying meteorology;
- deposition over a larger area; or
- specialized chemical transformation.
The dispersion modelling approach must be appropriate to the project and the regulatory requirements. The fact that CALPUFF can handle more complicated processes does not mean it should automatically replace AERMOD.
For many industrial particulate assessments, AERMOD remains the more practical model.
Primary PM versus secondary PM
This distinction is important enough to deserve its own section.
Primary particulate - The particles exist when they leave the source. Examples include:
- dust from a stockpile;
- road dust;
- particulate from a combustion source;
- mineral dust from mining; and
- filterable particulate from a stack.
Secondary particulate - The particles form later through atmospheric chemical reactions. A source may emit gases that contribute to the formation of particulate matter farther downwind.
 Secrets of particulate emissions
That's a substantially different modelling problem. A conventional AERMOD assessment can do an excellent job of representing primary particulate emissions, but full secondary PM₂.₅ formation may require specialized chemical-transport or photochemical modelling.
That is why secondary particulate modelling should not simply be added as another checkbox to a conventional air quality particulate matter assessment. See our separate discussion of secondary pollutants when that question becomes relevant.
Common particulate sources we model
Particulate matter appears in many different industrial settings.
Road dust - Vehicle traffic on paved or unpaved roads can produce particulate emissions that depend on traffic, vehicle characteristics, surface loading, moisture and other factors.
Construction activities - Can generate short-term fugitive particulate emissions from material handling, traffic and disturbed surfaces.
Concrete production - Material handling, aggregate movement, storage and process equipment can all contribute particulate emissions.
Mining - can involve multiple particulate sources, from extraction and processing through transportation and stockpiling.
Stockpiles - Wind erosion and material handling can produce highly variable fugitive emissions.
Combustion and process sources - Stacks, cooling towers and process vents can emit filterable and condensable particulate, with characteristics depending on the fuel, equipment and control system.
At Calvin, we have modelled a wide variety of these source types over the years.
From teepee burners to wet electrostatic precipitators
The particulate controls on industrial facilities have changed over time. In earlier projects, Calvin modelled emissions from sources such as teepee burners and related equipment. More recent projects have more often involved facilities equipped with wet electrostatic precipitators (WESPs) and other modern particulate-control systems.
 Bringing cleanliness to the next level
This matters because the emission rate isn't necessarily just a property of the process. It also depends on the control technology and its operating condition. A change in control equipment can therefore change both the emission rate and potentially the particulate characteristics being modelled.
When comparing historical and current emissions, the modeller needs to understand those changes rather than simply treating the old and new numbers as equivalent.
The model result can be wrong even when the model is right
This is an important distinction. Suppose the model software is functioning perfectly. The mathematical calculations are performed correctly.
The model still produces a poor assessment if the source information is wrong. For example:
- A condensable fraction might have been omitted.
- A PM₁₀ fraction might be based on the wrong industry.
- A stack test might represent a condition the facility never normally operates under.
- A historical emission rate might be used even though the control equipment has since changed.
- A particle density assumption might not represent the material.
The resulting output can be completely consistent with the input file and still not represent the real facility.
Good dispersion modelling begins with good source characterization.
When should the modeller refine the particulate representation?
Not every source requires the same level of detail. A simple source with robust measured PM₂.₅ data may need relatively little estimation. A source with only TSP measurements, substantial particle-size uncertainty and important deposition impacts may need much more attention.
Likewise, a facility with major fugitive dust sources may need source-specific treatment of:
- wind dependence;
- material moisture;
- surface conditions;
- traffic;
- particle size; and
- operating schedules.
The question is always: Would better particulate characterization materially change the assessment?
If the answer is no, more complexity may not be worthwhile. If the answer is yes, the extra work can be important.
That is professional judgement, not simply model setup.
The Calvin approach
Particulate modelling is one area where experience often shows up in small decisions.
- Which emission number is representative?
- Does a stack test include condensables?
- Should the industry-specific AEIR particle-size distribution be used?
- Is a default particle density reasonable?
- Has the facility changed since the last assessment?
- Does the control equipment operate the same way?
- Does the model need deposition, or is concentration the only issue?
- Is the source actually variable with wind, production or operating schedule?
These questions rarely appear on the model input screen. They are the questions that determine whether the input file represents reality.
Calvin Consulting has 30 years of experience with industrial air-quality dispersion modelling, including particulate assessments involving stacks, road dust, construction, concrete production, mining, stockpiles and a wide variety of fugitive sources.
We've worked with both historical and modern industrial facilities, from older combustion sources such as teepee burners to newer facilities using technologies such as wet electrostatic precipitators.
We also routinely work with stack-testing information and compare current and historical AEIR, NPRI and regulatory information when developing source parameters.
The model calculates what you tell it. Our job is to make sure what you tell it makes sense.
The main lesson
Particulate matter looks simple because we give it simple names:
- TSP.
- PM₁₀.
- PM₂.₅.
But behind those labels are questions about what was emitted, how it was measured, how much is condensable, how the mass is distributed by size, how dense the particles are, how they disperse and whether they deposit.
That is why air quality particulate matter modelling begins long before AERMOD or CALPUFF is started.
The first job is to understand the source. The second is to represent the source realistically. Only then should the modeller worry about the final concentration.
A technically perfect model built on the wrong particulate assumptions is still the wrong model.
Need help making sense of your particulate emissions?
A particulate-emission table can look deceptively simple.
A few numbers may actually represent different measurement methods, operating conditions, particle-size distributions and control technologies.
Before investing time in a detailed Air quality particulate matter model, it is often worth having someone familiar with dispersion modelling review the source information first.
Calvin Consulting can help determine:
- what the reported PM numbers actually represent,
- which information is useful for modelling,
- whether additional assumptions are necessary,
- and whether the modelling problem really requires the level of complexity being proposed.
That last question matters.
Not every particulate problem requires an elaborate model. But when particle characterization, deposition, fugitive emissions or unusual source conditions could change the result, getting the source representation right can save considerable rework later.
Contact Calvin Consulting Group to discuss your particulate emissions and determine the most defensible modelling approach before you build the model around the wrong number.

Let's talk about how we can simplify your air quality dispersion modeling needs. Let us handle the details so you can focus on running your business.
Clean air is our Passion...Regulatory Compliance is our Business.
Common mistakes
Treating all PM as PM₂.₅ : TSP and PM₂.₅ are not interchangeable.
Ignoring condensable particulate: For some sources, that can materially understate total particulate emissions.
Using the wrong industry particle-size distribution: An emission factor or size distribution developed for another source may not represent the facility being modelled.
Assuming particle density doesn't matter: It can, particularly for deposition.
Using a stack test without checking the operating condition: The measurement may be technically sound but not representative of the condition being modelled.
Treating historical AEIR or NPRI data as current without checking: Facilities change.
Assuming CALPUFF is automatically better: The most complicated model is not necessarily the most appropriate model.
Forgetting secondary PM: A plume may create particulate later through atmospheric chemistry. That's a different modelling problem.
Recent Articles


-
Air Quality Statistics: What Do All Those Numbers Actually Mean?
Sep 21, 26 12:00 AM
 How are air quality statistics used to understand pollution, design monitoring programs, estimate emissions and make environmental decisions?
 -
Surprising Air Pollution Facts: It's Not All Bad News!
Sep 17, 26 06:14 PM
 Trying to improve air quality has been a priority. Here are some air pollution facts to show you how far we've come.
 -
What is air quality and how can we fix it?
Sep 16, 26 11:19 AM
What is air quality? How do you define good air quality? It's just the opposite of air pollution.

What an experienced modeller checks before modelling PM
A particulate emission value should make sense before it ever reaches the dispersion model.
At Calvin, we would typically ask: What exactly is being reported?
- PM₂.₅?
- PM₁₀?
- TSP?
- Filterable?
- Condensable?
Where did the number come from?
- Stack test?
- AEIR?
- NPRI?
- Licence?
- Emission factor?
- Engineering calculation?
What operating condition does it represent?
- Typical operation?
- Maximum production?
- A particular fuel?
- A particular control-device condition?
Is the particle-size distribution appropriate?
- Measured data are valuable.
- Industry-specific Alberta guidance can provide a useful starting point.
- Source-specific information can be better still.
Does density matter? Especially when deposition is part of the assessment.
Are the model inputs physically consistent? Emission rate, flow, stack conditions and particle characteristics should describe a source that could actually exist.
Is this primary or secondary PM? If secondary formation matters, the modelling problem may have moved beyond conventional particulate dispersion.
Do you have concerns about air pollution in your area??
Perhaps modelling air pollution will provide the answers to your question.
That is what I do on a full-time basis. Find out if it is necessary for your project.
Have your Say...
on the StuffintheAir facebook page
Other topics listed in these guides:
The Stuff-in-the-Air Site Map
And,
Thank you to my research and writing assistants, and the author remains responsible for the content.
A practical particulate-modelling workflow
1. Identify the source
- Stack?
- Road?
- Stockpile?
- Conveyor?
- Construction area?
- Mining operation?
- Process equipment?
2. Identify the pollutant fraction
- TSP?
- PM₁₀?
- PM₂.₅?
- Filterable?
- Condensable?
3. Establish the emission rate
- Use the best defensible information available.
4. Determine the particle-size distribution
- Use measured data, manufacturer information, applicable AEIR methodology or other defensible information.
5. Determine particle properties
- Density and aerodynamic behaviour where relevant.
6. Define the operating condition
- Typical?
- Maximum?
- Variable?
- Intermittent?
- Weather dependent?
7. Select the modelling approach
- AERMOD for many conventional applications.
- CALPUFF or another approach where the physical or regulatory problem warrants it.
8. Check the result
- Does the predicted concentration or deposition pattern make physical sense?
That final step is easy to skip. It shouldn't be.
-
A particulate-modelling checklist
Before finalizing an Air quality particulate matter assessment, ask:
- Emission: What exactly is being emitted?
- Measurement: What was actually measured?
- Condensable: Is condensable PM included?
- Size: What particle-size distribution is appropriate?
- Density: Is the assumed density representative?
- Operation: What operating condition does the emission rate represent?
- Controls: What particulate-control equipment is operating?
- History: Do current AEIR, NPRI, licence and historical data make sense together?
- Model: Is AERMOD adequate, or does the problem require CALPUFF or another approach?
- Deposition: Does the assessment need to consider where the particles settle?
- Secondary formation: Could particles form chemically after release?
- Results: Does the predicted concentration pattern make physical sense?
Most Popular Pages on this Website:
Pictures of Global Warming
- See photos, cartoons, charts, graphs and a few surprises.
Clouds
- Don't know a cumulus from a stratus? Check here.
Causes of Global Warming
- It's not always obvious.
Calgary Alberta Weather
- Example of Canadian Goodness.
Thermometers
- Our favourite weather instrument.
- Home
- Contact Us
- Free E-zine Back Issues
- Privacy Policy
- Site Map - I'll help find something good.

By Barry Lough, P.Met., EP (Environmental Professional)
Text copyright © 2003-2026 Stuff in the Air.com
BACK TO TOP - Hit your 'Home' Key