- Air Homepage
- Weather Radar
- Map Radar Weather
Map radar weather!
What does it look like?
WHEN WE MAKE A MAP radar weather data needs to be understood. Weather radar equipment gives you a chance to appreciate both the stuff in the air and the physics behind it.
Find more about weather radar.
Here's how weather radar works: The Science of Rain - Simple radio waves can detect hidden hailstorms hundreds of miles away before they hit your town! Explore the amazing physics of weather radar...from the microwave pulses it sends, to the maps it creates to give us a three-dimensional view.
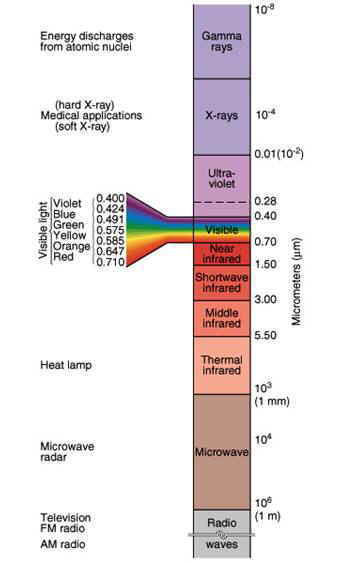
After that, you'll be able to interpret the radar pictures. Let's start with an electromagnetic spectrum diagram.
Kelly from Canada asks: WHAT IS A RADAR WAVE? Radar waves don't exist. RADAR stands for radio detection and ranging. Simply put: RADAR equipment uses radio waves to find distances and locations. "Radio wave" is the right term.
All radars use microwave radiation. You probably learned about electromagnetic radiation in high school.
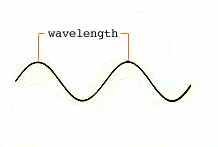
Remember the old illustrations where it looked like waves in ocean pictures? A wavelength is the distance between the top of one wave and the top of the next. One cycle.
Calculation wavelength
Light, radar, radio, X-rays, infrared, and other electromagnetic waves are electromagnetic waves. A wavelength in metres multiplied by a frequency in Hertz, cycles per second, is almost exactly three hundred million in air or outer space.
That's 300,000,000 meters per second, the speed of light. Radar wavelengths used by map radar weather services and other radars are a little less than one metre, so we say centimetres. It's about 4 inches in 10 cm.
MegaHertz (MHz) is more practical at really high frequencies. Multiplying cm and MHz will always give thirty thousand (30,000). Radar technicians use this rule of thumb.
How does radiation relate to radar?
Radar is available in different bands, like radio is available in AM and FM. This article goes into more detail. Their wavelengths range from under half an inch (0.86 cm, actually) to almost a foot (23 cm). It would be near the top of the brown microwave band in the drawing, near the IR spectrums.
In addition to the K-band radars used for aviation and local weather forecasting, we also have radars used by ships and police.
C-band is for weather surveillance, S-band is for aviation and weather, and microwave ovens use S-band. Last but not least, L-band is usually used by air traffic control. That's a map radar weather stations take up only one small part of.
Radar signals aren't sent or received constantly. Instead, it alternates between sending a short burst and waiting a long time for a response.
The pulse repetition frequency (PRF) of a weather radar is about 600 times a second. With that, you can see out to about 150 miles (250,000 metres) with certainty. Here,
use this formula.
Whenever a signal comes back after more than 1/600th of a second, it must have travelled farther. Now it can get mixed up with new reflected signals and get called "ambiguous". Objects farther away on the map, like radar weather, will normally reflect a weaker signal.
Another radar problem, anomalous propagation (AP) occurs when radar signals behave abnormally because of the atmosphere. It happens when the radar signal hits a layer of warm air above a cooler surface and instead of reflecting the radar signal back to the antenna, this layer of warm air acts as a duct. Radar data can be misinterpreted, causing weather forecasting and air traffic control errors. See some examples of anomalous propagation on this webpage
Radar detects things falling within a small angle, about 1° wide and high. The antenna, which looks like a backyard satellite dish, has to move fast. As it goes around and around, it maps radar weather pictures of the whole volume of atmosphere around it.
Azimuth is measured left and right, and elevation is measured up from the horizon.
Weather displays based on radar
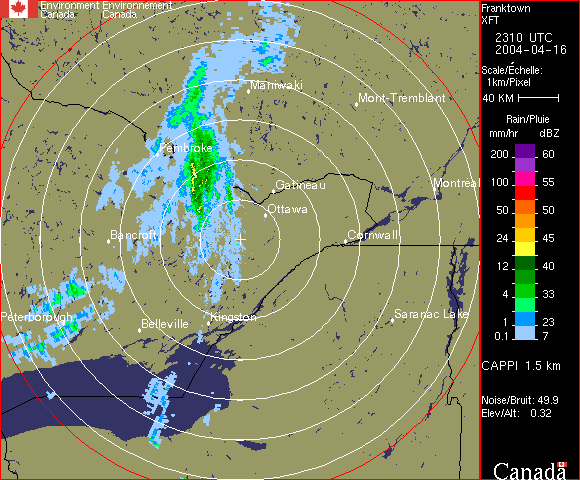
A map radar weather location is represented by a dot at the center of a series of concentric rings. About 300 miles wide is the biggest ring.
This display is called a Plan, which is viewed from above the Position Indicator (PPI). As seen from directly above, it depicts an image that would be drawn on the inside of a wide cone with its point touching the ground at the center.
Therefore, the farther the image is from the dot (small cross in the sample below), the higher it is from the ground. A flat image can't tell you how much.
Now we take the dozens of cones the radar produces, each with its own width. Put them all on top of a single point and slice straight across at some height. You can get a composite image of about one altitude.
Forecasting departments use this CONSTANT ALTITUDE plan position indicator (CAPPI), which is a more useful map radar weather forecasters use.
This radar displays the reflectivity of precipitation at a fixed altitude. CAPPI displays a 3-dimensional view of precipitation in weather forecasts. It shows how much precipitation is reflected at a constant altitude, usually somewhere between 1 and 20 kilometers.
A radar antenna emits radio waves and measures the reflected waves from precipitation particles to generate a radar CAPPI image. The resulting image tells meteorologists about the height, intensity, and structure of precipitation in a given area.
You can use radar CAPPI images to track storm movements, identify areas of heavy rain, and forecast severe weather events like thunderstorms, hail, and tornadoes. In general, radar CAPPI is a vital tool in modern weather forecasting, providing accurate and timely information to the public and decision-makers to help them make informed decisions.
It's one of the more technical areas of weather forecasting. A substantial amount of support is required from the meteorological department to put this together properly.
#13
Search this site for more information now.
Go back from Map Radar Weather to
Radar Real Time Weather
What are you looking at on the map radar weather?
What is the best way to map radar weather data so that people are aware of what is happening? See Displays of radar images and plans.
Do you have concerns about air pollution in your area??
Perhaps modelling air pollution will provide the answers to your question.
That is what I do on a full-time basis. Find out if it is necessary for your project.
Have your Say...
on the StuffintheAir facebook page
Other topics listed in these guides:
The Stuff-in-the-Air Site Map
And,
Thank you to my research and writing assistants, ChatGPT and WordTune, as well as Wombo and others for the images.
OpenAI's large-scale language generation model (and others provided by Google and Meta), helped generate this text. As soon as draft language is generated, the author reviews, edits, and revises it to their own liking and is responsible for the content.


New! Comments
Do you like what you see here? Please let us know in the box below.