- Air Homepage
- Air Quality Modelling Service
- Air Quality Testing
- Air Pollution By Cars
Air Pollution by Cars: What Causes It and How Can We Reduce It?
Cars give us freedom to travel, get to work, visit friends and explore the world. They also leave something behind: Air pollution by cars...a mixture of gases and tiny particles that can affect the air we breathe.
The good news is that vehicle pollution has been reduced through better engines, cleaner fuels and improved emissions controls. There is still work to do, especially around busy roads, schools, neighbourhoods and industrial areas with heavy traffic.
Air pollution by cars is more complicated than exhaust coming out of a tailpipe. Understanding where the pollution comes from, how it affects people and what actually reduces it can help us make better choices as drivers, communities and professionals.
Here's a simple guide to the science, which separates common misconceptions from the facts and explains when air quality monitoring or computer modelling can help answer more difficult questions.
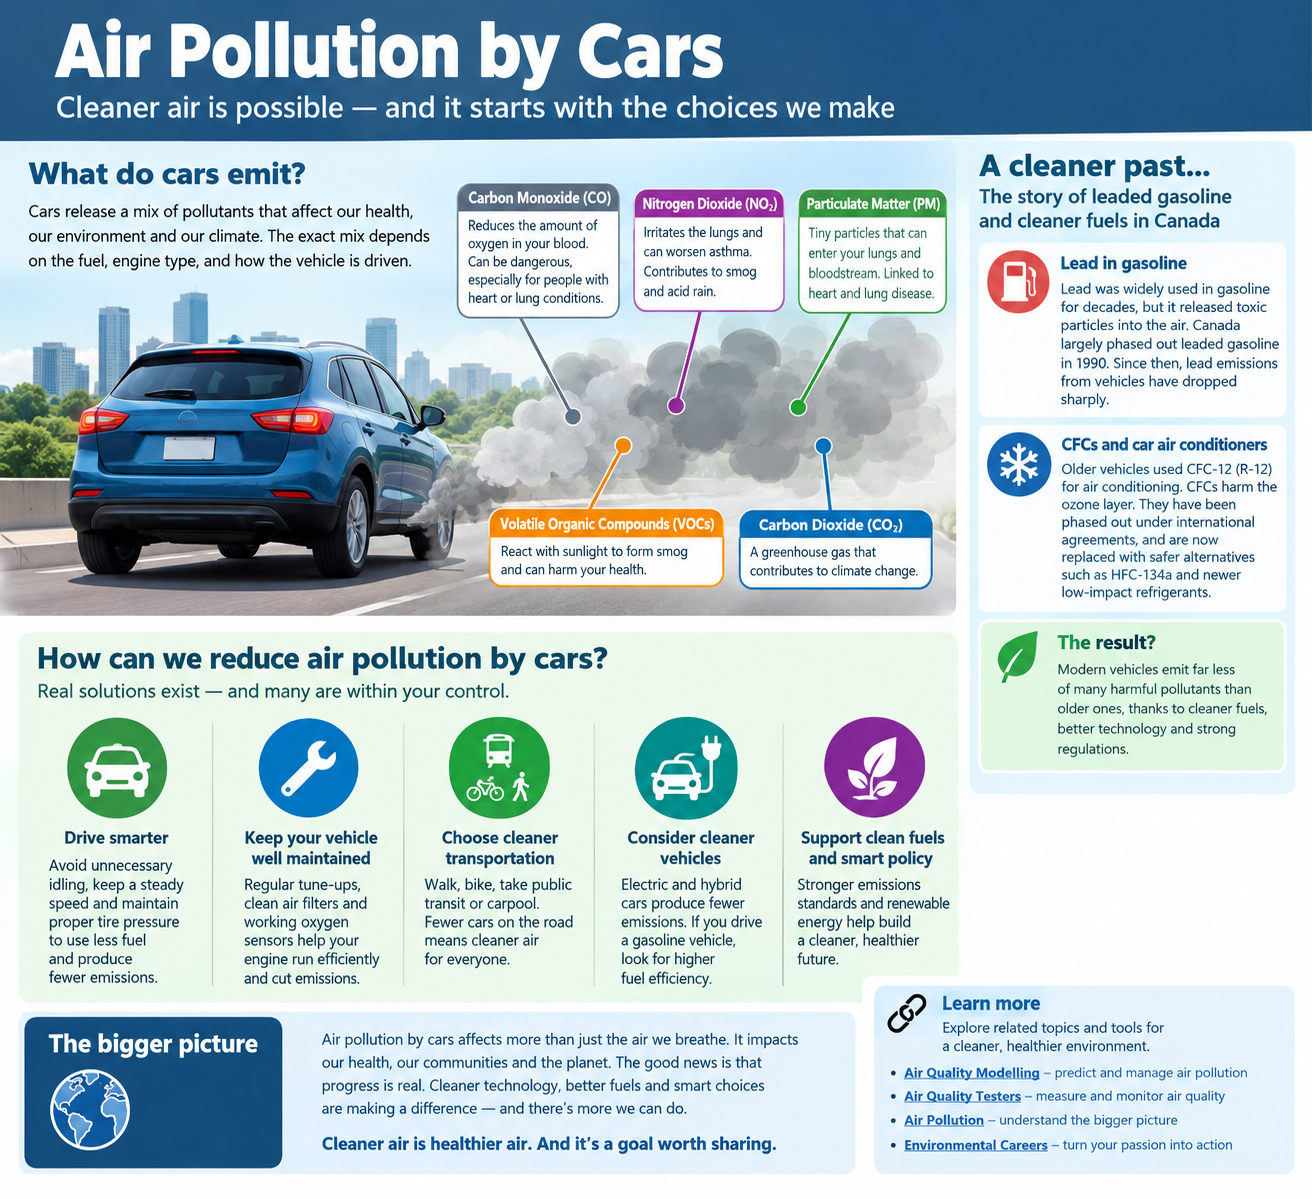
What do we mean, air pollution by cars?
A gasoline or diesel vehicle can release several different pollutants. Traffic also creates pollution through friction, evaporation and the movement of dust.
Pollutant or source
Where it comes from
Why it matters
Carbon monoxide (CO)
Incomplete combustion of fuel
Reduces the blood's ability to carry oxygen. High concentrations can be dangerous or fatal.
Nitrogen oxides (NOx)
High-temperature combustion in engines
Help form ground-level ozone and contribute to other air pollution. Nitrogen dioxide (NO₂) can irritate the lungs.
Fine particles (PM₂.₅)
Exhaust, especially from some diesel engines, plus other combustion and non-exhaust sources
Tiny particles can travel deep into the lungs and are linked to heart and respiratory problems.
Volatile organic compounds (VOCs)
Fuel evaporation and combustion
Some are harmful in their own right. Some react with nitrogen oxides in sunlight to form ground-level ozone.
Brake and tire particles
Wear during braking and driving
Add particles and metals to the air and nearby environment.
Road dust
Traffic lifts dust from road surfaces
Adds airborne particles, particularly where roads are dusty or traffic is heavy.
Carbon dioxide (CO₂)
Burning gasoline or diesel
A greenhouse gas that contributes to climate change.
Air pollution by cars is a mixture, so there is no single pollutant that tells the whole story. The mix depends on the vehicles, fuels, traffic conditions, weather and surrounding environment.
For a more detailed explanation, see Air Pollution and Air Pollution from Vehicles in the Air Quality and the Environment section of this website.
Air pollution, climate change and noise: What is the difference?
These problems are connected, but they are not interchangeable.
Air pollution concerns substances in the air that can harm human health or the environment. Examples include carbon monoxide, nitrogen dioxide and fine particles.

Climate change concerns long-term changes in Earth's climate. Carbon dioxide from burning fuel is a major contributor because it traps heat in the atmosphere. Some air pollution by cars, including black carbon, can also affect the climate.
Traffic noise is a separate environmental problem. It can disturb sleep, increase stress and affect well-being, even when air pollution levels are relatively low.
One action can help with more than one problem. Driving less can reduce fuel consumption, greenhouse gas emissions, traffic-related air pollution and noise. However, a solution that reduces one pollutant may have a different effect on another. That is why good environmental decisions begin by identifying the problem being addressed.
For more background, explore Air Pollution and Global Warming, Global Warming Introduction and What Is the Air Made Of?
How does vehicle pollution affect people?
Imagine standing beside a busy road during rush hour. Hundreds or thousands of vehicles pass by, each contributing some combination of exhaust gases, particles and road dust.
Pollutants can be highest close to busy roads, although the actual concentrations depend on traffic, wind, nearby buildings and other conditions. Air pollution by cars can also travel away from its original source.
Traffic-related air pollution has been associated with asthma symptoms, reduced lung function, cardiovascular disease and other health effects. Children, older adults and people with existing heart or lung conditions can be especially vulnerable.
There is an important distinction between emissions, concentration and exposure:
- Emissions are the amount of pollution released by a source.
- Concentration describes how much of a pollutant is present in a volume of air.
- Exposure describes the air a person actually breathes over time.
A vehicle may release pollution, but the amount reaching a person depends on where that person is, how the pollution disperses and how long the person is exposed.
 Is this your classic gas-guzzler?
This explains why two homes at similar distances from a highway may experience different air quality. Buildings, terrain, wind direction, traffic patterns and other emission sources can all make a difference.
For teachers and students: try comparing a busy intersection, a quiet residential street and a park on the same day. What might make the air different at each location? Which measurements would you need to test your predictions?
What can drivers do to reduce air pollution?
Individual actions cannot solve every traffic-related air quality problem, but they can help. Some measures also save fuel and money.
Action
Why it helps
Walk, cycle or use public transit when practical
Reduces the number of vehicle trips and the associated emissions. Walking and cycling also provide physical activity.
Combine errands
Avoids unnecessary trips, reducing fuel use and emissions.
Avoid unnecessary idling
Reduces fuel consumption and emissions while the vehicle is stationary. Follow manufacturer guidance and local rules.
Drive smoothly
Avoiding unnecessary rapid acceleration and hard braking can improve fuel economy.
Maintain the vehicle
Correct tire pressure, timely servicing and properly functioning emissions controls help the vehicle operate as intended.
Choose an efficient vehicle
A vehicle that uses less fuel generally releases less CO₂ per kilometre, all else being equal. Pollutant emissions also depend on its technology and condition.
Carpool when practical
Sharing journey among more people can reduce the number of vehicles needed.
A few cautions are worth remembering. Changing an air filter or spark plug is useful when maintenance is due, but replacing parts that are working properly will not necessarily produce a meaningful reduction in emissions. Never disable or remove emissions-control equipment.
And remember that walking, cycling and public transit need safe, accessible routes to be realistic options for everyone.
Are bigger vehicles always more polluting?
A large vehicle often uses more fuel than a smaller, more efficient vehicle travelling under comparable conditions. That generally means more CO₂ per kilometre. But vehicle size alone does not determine every pollutant.
Engine technology, fuel type, emissions controls, vehicle age, maintenance and driving conditions all matter. A newer large vehicle may have lower emissions of some pollutants than an older poorly maintained vehicle. A smaller vehicle can still produce harmful emissions.
The most useful comparison is based on actual fuel consumption and emissions performance rather than appearance alone. When comparing vehicles, consider:
- Fuel use per distance travelled.
- Tailpipe emissions of air pollution by cars that affect local air quality.
- The vehicle's age and emissions-control technology.
- How far and how often it will be driven.
- Whether a hybrid or electric vehicle meets the same transportation needs.
This is a better way to make a practical choice than assuming that every vehicle in one size category performs the same way.
Do electric cars have zero emissions?
Electric vehicles have zero tailpipe emissions while driving. They do not release exhaust from burning gasoline or diesel. That can reduce pollution where people live, work and travel.
However, the electricity used to charge an electric vehicle has to be generated. Depending on the electricity supply, that generation can produce emissions elsewhere. Manufacturing vehicles and batteries also requires energy and materials.
Three concepts help keep the comparison clear:
- Tailpipe emissions: pollutants released directly by the vehicle while operating.
- Electricity-generation emissions: pollution associated with producing the electricity used to charge the vehicle.
- Lifecycle emissions: emissions associated with manufacturing, energy supply, use and other stages of a vehicle's life.
Electric vehicles can also produce tire and road-wear particles because they still travel on roads. Their weight, tire choice, driving style and regenerative braking can influence non-exhaust emissions.
In general, electric vehicles can substantially reduce local tailpipe pollution and often have lower lifetime greenhouse gas emissions than comparable gasoline vehicles. The exact benefit depends on the vehicle, electricity supply and lifecycle assumptions.
The practical takeaway is simple: electric vehicles are an important tool for reducing transport pollution, alongside cleaner electricity, public transit, efficient land use and fewer unnecessary car trips.
How do car manufacturers reduce emissions?
Vehicle manufacturers use several technologies to reduce fuel consumption and harmful pollutants.
- Catalytic converters help convert certain exhaust pollutants into less harmful substances.
- Diesel particulate filters capture much of the soot produced by diesel engines.
- Engine management systems control fuel delivery and combustion.
- Exhaust-gas treatment systems can reduce nitrogen oxides and other pollutants.
- Hybrid systems use electric motors to reduce fuel consumption in suitable driving conditions.
- Aerodynamic design and lower vehicle mass can reduce the energy needed to move a vehicle.
These technologies have helped reduce emissions from modern vehicles compared with many older models. Their effectiveness depends on design, operating conditions, maintenance and whether the equipment is functioning properly.
Regulations also matter. Vehicle emissions standards set requirements that manufacturers must meet. Testing and enforcement help ensure that vehicles perform as intended.
Cleaner vehicle technology is part of the answer. The number of vehicles on the road, the distances they travel and the way communities are designed also affect total pollution.
Why can traffic still cause poor air quality?
A modern vehicle may emit much less of a particular pollutant than an older vehicle. Yet a neighbourhood can still experience air pollution by cars when many vehicles travel through the same area.
Think of a busy road as a collection of many small sources. Each vehicle adds a little pollution, and the combined effect depends on how much traffic passes, the type of vehicles, how the air moves and what other sources are nearby.

Weather can change the outcome. Wind may carry pollution away from a road or toward nearby homes. Buildings can change airflow. During calm conditions or an atmospheric inversion, pollutants may disperse less effectively.
The location of people matters, too. A school playground beside a busy road raises different questions from a highway running through an area with few nearby residents.
These are reasons to look at the local situation rather than relying on a general statement about how clean a vehicle is.
For more on the role of weather, explore Calm Weather and Inversions, Storm Formation and Measuring Wind Speed and Direction. The atmosphere is constantly moving, and understanding that movement helps explain why air quality can vary from place to place and day to day.
How do scientists measure and predict air pollution?
There are two useful approaches: air quality monitoring and air quality dispersion modelling.
Monitoring uses instruments to measure pollutants in the air at particular locations and times. It can show what concentrations occurred where and when measurements were taken. The results depend on the instrument, its location, the pollutants measured and the duration of the monitoring program.
Dispersion modelling uses mathematical calculations to estimate how pollutants released by a source may spread through the atmosphere. Depending on the purpose, a model can use source information, weather data, terrain and the locations of nearby receptors to predict concentrations.
Question
Monitoring
Dispersion modelling
What does it tell us?
What the instruments measured at selected locations and times
What concentrations are predicted under defined assumptions
Does it require a physical site?
Yes
Not necessarily; it requires suitable source and environmental data
Can it assess a proposed source before it operates?
No direct measurements from that future source are available
Yes, using an appropriate scenario and defensible inputs
What are its limitations?
Measurements cover specific places, periods and pollutants
Results depend on model suitability, inputs, assumptions and uncertainty
The methods can complement each other. Monitoring can help establish existing conditions or evaluate actual operations. Modelling can help assess proposed changes, compare scenarios and identify locations where higher concentrations may occur.
Neither method automatically answers every health question. Predicted or measured concentrations may need to be combined with exposure information and specialist health-risk assessment before conclusions can be drawn about specific health outcomes.
When might professional air quality modelling be useful? A professional assessment may be worth considering when:
- A development is proposed near a busy road or other significant emission source.
- A facility needs to assess the air quality implications of a planned operating change.
- An approval or permit requires an assessment against applicable air quality criteria.
- Monitoring results raise questions about where pollution is coming from.
- A company needs to compare mitigation options before investing in equipment or changing operations.
The appropriate method depends on the question. Some situations need monitoring, others need modelling and some benefit from both.
I work for a firm that provides air quality dispersion modelling and regulatory support for industrial projects. Its work illustrates how source information, meteorology, terrain and applicable criteria can be brought together to assess a proposed operation. Industrial flare assessments are a different application from road traffic studies, but they demonstrate the broader principle: credible predictions require suitable inputs, an appropriate method and professional interpretation.
For more information, visit Air Quality Modelling and Air Quality Testers.
What about the air inside a car?
The air inside a vehicle can contain air pollution by cars...from outdoor traffic, vehicle exhaust and materials inside the cabin. Exposure varies with ventilation settings, traffic conditions, the vehicle and the surrounding air.
A new car smell is not a reliable measure of whether the air is safe or unsafe. Some materials can release volatile organic compounds, but the chemicals and concentrations vary. Smell alone cannot identify every pollutant or establish its health risk.
To reduce exposure where practical:
- Maintain the cabin air filter according to the vehicle manufacturer's instructions.
- Use the vehicle's ventilation and recirculation settings appropriately for the conditions.
- Avoid leaving the engine running in an enclosed garage.
- Pay attention to exhaust entering the cabin, and have the vehicle checked if this occurs.
An ordinary cabin filter may reduce some particles, depending on its design and condition, but it will not necessarily remove gases. Follow the manufacturer's advice and avoid assuming that a filter eliminates every air quality concern.
For more on pollution inside buildings and enclosed spaces, see Indoor Air Pollution.
Where can you learn more?
The following pages connect vehicle pollution to the wider science of air quality, weather and environmental decision-making.
Explore more on this website
Air Pollution: An introduction to the sources and effects of pollution in the atmosphere.
Air Pollution from Vehicles: More on traffic-related emissions and ways to reduce them.
Air Pollution and Global Warming: How local air pollution differs from greenhouse gas emissions and where the issues overlap.
Air Quality Modelling: How mathematical models help predict pollutant concentrations.
Air Quality Testers: Information on air quality testing and assessment.
Indoor Air Pollution: Sources of pollution in homes, vehicles and other enclosed spaces.
Calm Weather and Inversions: Why some weather conditions allow pollution to accumulate.
Measuring Wind Speed and Direction: How wind observations help us understand the movement of air.
What Is the Air Made Of?: A foundation for understanding the gases that make up the atmosphere.
Atmosphere Lesson Plans for Teachers: A starting point for connecting air pollution to classroom science.
Science Fair Project Ideas: Ideas for students who want to investigate a question rather than simply repeat a fact.
Reliable sources for further reading
For readers who want evidence beyond a general introduction, these government and scientific resources are good starting points:
- Health Canada - Traffic-related air pollution. Explains the mixture of pollutants from exhaust, tire and brake wear, road dust and fuel evaporation, along with Canadian evidence on health effects and practical ways to reduce exposure.
- Health Canada - Health impacts of traffic-related air pollution in Canada. Provides a more detailed review of the evidence linking traffic-related pollution with health outcomes.
- Government of Canada - Air pollutant emissions. Provides national emissions information and helps distinguish transportation emissions from emissions across other sectors.
- Government of Canada - Benefits of driving an electric vehicle. Discusses local air pollution and lifecycle emissions associated with electric vehicles.
- World Health Organization - Transport: sectoral solutions for air pollution and health. Explains the connections between transport, pollution, health and policy.
- US Environmental Protection Agency - Smog and vehicle emissions. Offers a useful explanation of tailpipe pollutants and the role of vehicles in forming smog.
These sources are particularly useful for checking numerical claims. Emissions statistics change with the year, location, vehicle fleet and definition being used, so a statistic should always be linked to its original source and context.
The bottom line: Cleaner air takes more than cleaner cars
Reducing air pollution by cars involves better vehicle technology, sensible maintenance, practical travel choices and communities designed to make cleaner transportation possible. Understanding local conditions matters because traffic emissions do not translate into the same concentrations everywhere.
- For students, the topic is an excellent example of science in everyday life: chemistry explains the pollutants, physics explains how they move and meteorology helps explain why they accumulate in some conditions.
- For professionals, the same principles support decisions about monitoring, modelling, mitigation and environmental approvals.
- Know someone who would enjoy exploring the science behind the air we breathe? Share this page with a student, teacher, colleague or friend. Then follow the links above to explore the topic that interests them most.
- And when a question goes beyond general knowledge - when a proposed development, busy road or industrial operation needs a defensible assessment - Air Quality Modelling and Air Quality Testers are useful places to start.
Understanding air pollution by cars is a first step toward asking better questions, finding sound evidence and making decisions that help keep the air cleaner for everyone.
Find more about air pollution.
Search this site for more information now.
Recent Articles


-
Ambient Air Quality Monitoring Equipment Station Siting: AMD Chapter 3
Oct 29, 26 03:22 PM
 Learn Alberta AMD Chapter 3 siting requirements for ambient air quality monitoring equipment, wind instruments and samplers. Practical guidance.
-
Ambient Air Monitoring Equipment Specifications
Oct 25, 26 05:01 PM
 Chapter 4 of Alberta's Air Monitoring Directive, specifying ambient air monitoring equipment and technical requirements for good air quality data.
-
Alberta Air Monitoring Directive - AMD Compliance Guide
Oct 22, 26 03:21 PM
Understand the Alberta Air Monitoring Directive, monitoring requirements, quality assurance, audits and reporting. Practical guidance for industrial facilities.
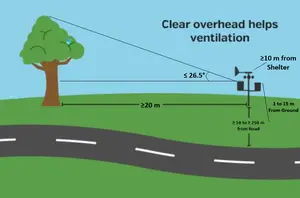



A small science activity: Where does traffic pollution go?
This is a useful classroom discussion, science-fair starting point or family activity.
The question: Does the amount of traffic alone tell us which location has the highest air pollution?
Make a prediction: Compare three locations, such as a busy road, a quiet street and an open area away from traffic. Predict which location might have the highest concentrations of traffic-related pollutants.
Identify the variables: Consider traffic volume, vehicle types, wind direction, wind speed, buildings and distance from the road.
Find evidence: Look for available official air quality monitoring data. Compare locations and times only when the measurements and conditions are reasonably comparable. Do not assume that a simple visual observation or a low-cost sensor can identify every pollutant.
Discuss the result: Did the evidence support the prediction? What additional information would improve the comparison?
A proper scientific investigation separates observations from assumptions. It also recognizes that one measurement at one location cannot describe every street or every day.
Teachers may also find useful material in Atmosphere Lesson Plans for Teachers, Science Fair Project Ideas, Meteorology for Kids and Ways to Prevent Air Pollution.
===
Do you have concerns about air pollution in your area??
Perhaps modelling air pollution will provide the answers to your question.
That is what I do on a full-time basis. Find out if it is necessary for your project.
Have your Say...
on the StuffintheAir facebook page
Other topics listed in these guides:
The Stuff-in-the-Air Site Map
And,
Thank you to my research and writing assistants, and the author remains responsible for the content.
===
Cars Are Cleaner Than They Used to Be
It is easy to focus on the pollution cars produce today and forget how much worse some emissions used to be. A look at automotive history shows that regulations, better technology and changes in the fuels we use can make a substantial difference.
The end of leaded gasoline
For decades, gasoline contained lead compounds that helped engines run without knocking. The trouble was that burning this fuel released lead particles into the air. Lead is a toxic metal that can damage the brain and nervous system, with children especially vulnerable to its effects.
Canada began restricting lead in gasoline during the 1970s. Airborne lead levels fell considerably as unleaded fuel became more common. Federal regulations that took effect in 1990 virtually eliminated leaded gasoline from ordinary road use. Some specialized uses, including aviation fuel for piston-engine aircraft, have remained exempt.
The improvement was substantial. Government of Canada data show that lead emissions from all Canadian sources fell from more than 21,000 tonnes in 1970 to about 1,300 tonnes in 1990. These figures cover all sources, not just cars, but the phase-out of leaded gasoline was a major part of the reduction. Today, lead from ordinary car exhaust is no longer the widespread urban pollution problem it once was. Lead can still enter the environment from other sources, and residues from past emissions remain in some soils and dust.
What about fluorocarbons and car air conditioners?
Older vehicle air conditioners often used a refrigerant called CFC-12, also known as R-12. Chlorofluorocarbons (CFCs) were widely used in refrigeration and other products because they worked well and were chemically stable. Unfortunately, that stability allowed them to reach the upper atmosphere, where they damage the ozone layer that protects life from harmful ultraviolet radiation.
International action under the Montreal Protocol led to the phase-out of CFCs in new equipment and a major reduction in their use. In vehicle air conditioners, CFC-12 was largely replaced by HFC-134a. That solved the ozone-depletion problem associated with CFCs, although HFC-134a is a powerful greenhouse gas if it escapes. Newer vehicles have increasingly moved to refrigerants with much lower global-warming potential, including HFO-1234yf.
These refrigerants are different from the pollutants usually discussed in connection with exhaust. They can escape through leaks, servicing or disposal of air-conditioning equipment rather than being produced by normal fuel combustion. Proper servicing and refrigerant recovery help prevent their release.
The bigger lesson
Modern vehicles generally produce far less of several harmful pollutants than older vehicles did, thanks to cleaner fuels, catalytic converters and improved engine controls. That is real progress. It does not mean traffic pollution has disappeared: vehicles still emit pollutants and greenhouse gases, while brakes, tires and road dust produce particles even when engines are clean.
The history of leaded gasoline and ozone-depleting refrigerants shows that environmental problems can be reduced when science identifies the risk and practical changes follow.
Cleaner cars are an achievement worth recognizing, with further improvements still possible.

By Barry Lough, P.Met., EP (Environmental Professional)
Text copyright © 2003-2026 Stuff in the Air.com
BACK TO TOP - Hit your 'Home' Key