- Air Homepage
- Air Quality Modelling Service
- Air Quality Testing
- Air Pollution Facts
Air Pollution Facts: How We Cleaned Up the Air and What Still Needs Work
Air pollution facts: is the air actually getting worse?
Here is a surprising piece of good news: For many important air pollutants, the long-term trend in Canada is strongly positive. That doesn't mean the air is always clean.
Wildfire smoke can turn a blue-sky afternoon into a very unhealthy one. Ground-level ozone remains a problem. Local industrial emissions still matter. Some pollutants have not improved much and ammonia emissions have increased.
The bigger story is more interesting: We have actually gotten much better at controlling many kinds of air pollution. That happened through a combination of science, regulation, cleaner fuels, better equipment, emission controls and better information.
These are useful air pollution facts because they demonstrate something that can get lost in environmental discussions: Environmental problems can be real, serious and solvable.
Find more facts about air pollution.
Air pollution facts worth knowing
Here are seven to keep in your back pocket.
1. Canada's emissions of several major air pollutants have fallen dramatically since 1990.
In 2024, national emissions of sulphur oxides were about 81% lower than in 1990. Nitrogen oxides were 46% lower, volatile organic compounds 38% lower, carbon monoxide 66% lower and PM₂.₅ 22% lower. Ammonia went the other direction, increasing by about 28%.
2. Cleaner air did not happen by accident. Vehicle standards, cleaner fuels, industrial controls, process changes and better technology all contributed.
3. Lead is a spectacular success story. The phase-out of leaded gasoline removed a major source of airborne lead exposure.
4. Emissions and air quality are related, but they are not the same thing. Weather, terrain, chemistry and the location of a source all affect the concentration people actually experience.
5. Wildfire smoke can overwhelm long-term progress for short periods. Canada's national PM₂.₅ record shows exactly that.
6. Different pollutants tell different stories.
NO₂ and SO₂ have generally improved. Ozone has shown little national long-term change. PM₂.₅ is strongly affected by wildfire years.
7. We can measure progress.
Monitoring stations, emissions inventories and dispersion models give us different ways to see what is happening.
Those may be the most useful air pollution facts on this entire page.
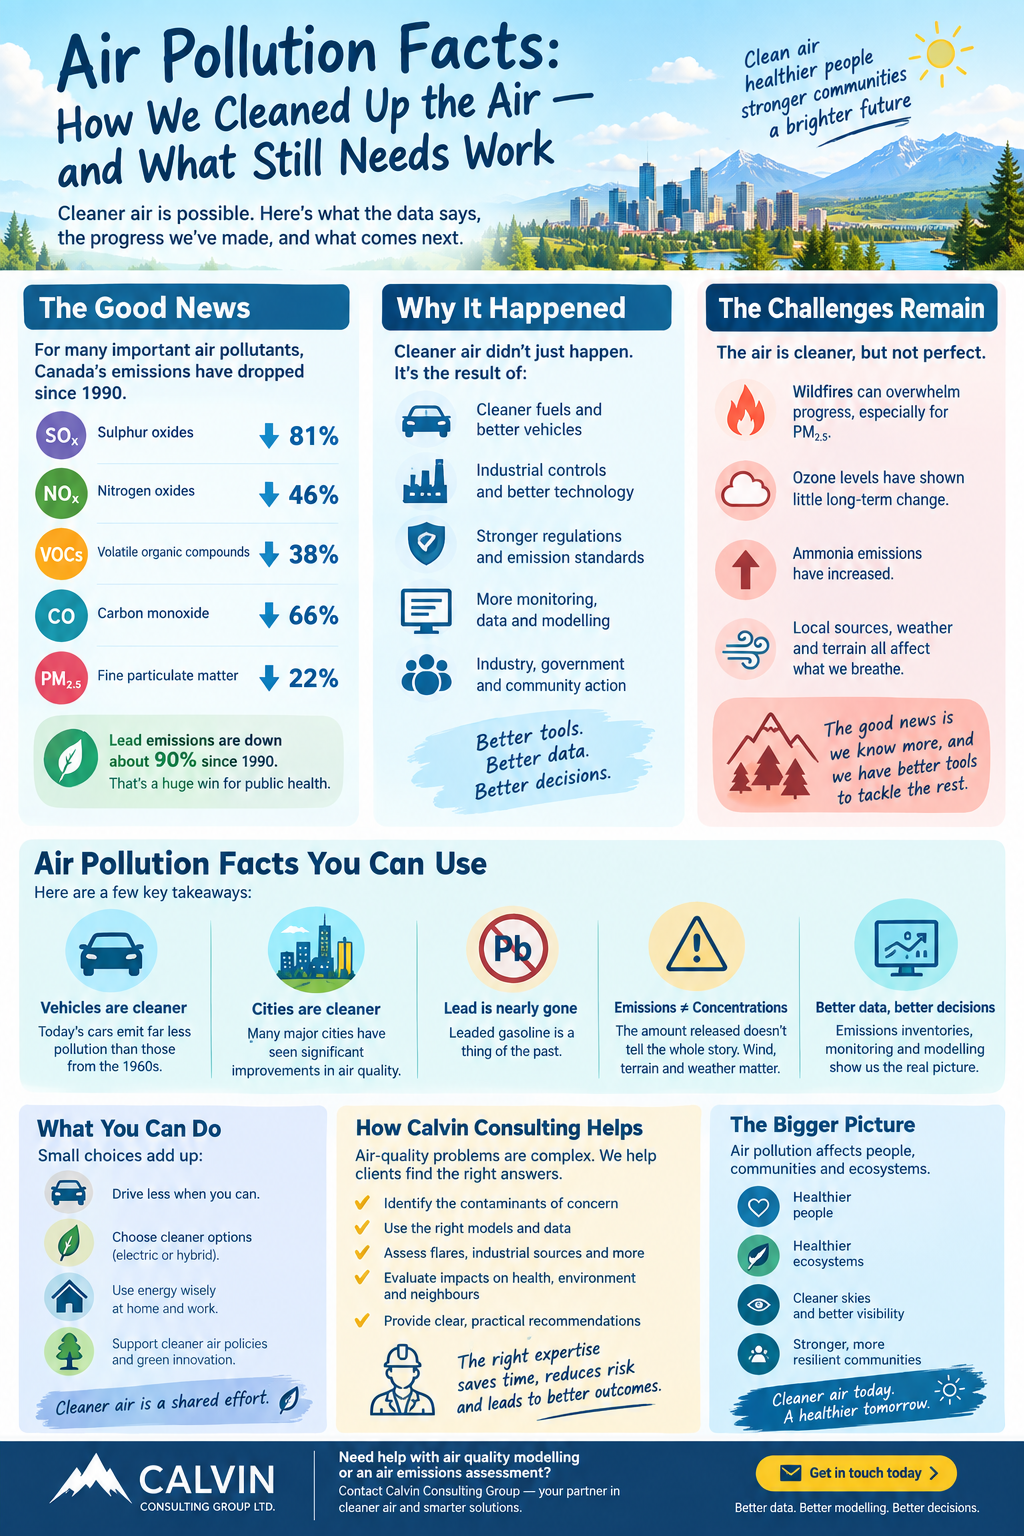
The great air-pollution success stories
- Lead: a pollutant we actually pushed out of the air
Lead is one of the clearest examples of environmental regulation producing a measurable result. Lead was once widely released into the atmosphere by vehicles burning leaded gasoline.
Then the rules changed. Leaded gasoline was phased out and emissions controls improved. The result was a dramatic reduction in airborne lead.
Canada's current emissions inventory shows that lead emissions in recent times were about 90% below 1990 levels.
That is more than an interesting statistic. It is a lesson in how environmental improvement works:
Identify the pollutant → understand its source → change the technology or rule → measure the result.
- Cars got dramatically cleaner
Cars have not disappeared. There are more of them. Yet vehicle emissions of several conventional air pollutants have fallen enormously over the long term.
How? Cars gradually acquired a remarkable collection of pollution-control technology:
- unleaded fuel
- catalytic converters
- electronic engine controls
- evaporative-emission controls
- increasingly stringent emission standards
- cleaner fuels
Canada's recent emissions data show large long-term reductions in transportation-related carbon monoxide, nitrogen oxides and VOC emissions as regulations, cleaner fuels and technology improved.
The lesson is bigger than cars. The cleanest solution is often to stop producing the pollutant in the first place. That principle shows up everywhere in air-quality engineering.
- Industrial air pollution changed too
The same basic story happened in industry. Facilities became more efficient. Combustion equipment improved.

Pollution-control equipment became more capable. Fuels changed. Operating practices improved.
Regulators introduced more stringent requirements. And companies got better information about what they were actually releasing.
Alberta's air-quality system now includes extensive emissions reporting, ambient monitoring and modelling requirements. The province's Annual Emissions Inventory Reporting program requires EPEA-approved industrial facilities to inventory their emissions and submit the results. Alberta also makes quality-assured ambient air and industrial emissions data available through its Air Data Warehouse.
These databases matter because better information produces better decisions. They also make industrial emissions more visible to the public.
That visibility can be uncomfortable. It is also useful.
- Air pollution facts: standards changed too
An easy detail to miss is that the bar itself can move. Western Canadian jurisdictions have tightened ambient air-quality objectives and standards over the years as scientific understanding has improved.
Canada moved from the older Canada-wide Standards for some pollutants to the Canadian Ambient Air Quality Standards, or CAAQS. The current national framework includes standards for PM₂.₅, ozone, sulphur dioxide and nitrogen dioxide, with the standards becoming more stringent over time.
For example,
- The 2025 CAAQS for one-hour NO₂ is 42 parts per billion compared with 60 ppb for the 2020 standard.
- The 2025 SO₂ one-hour standard is 65 ppb compared with 70 ppb for 2020.
- The 2030 PM₂.₅ standards are also becoming more stringent.
Alberta also maintains its own Ambient Air Quality Objectives and Guidelines. These values are used in regulatory applications, facility approvals, impact assessment and monitoring. Alberta says they may be updated as scientific information, monitoring technology and other considerations evolve.
So another of the useful air pollution facts is this: Success can mean both lower pollution and a better understanding of what counts as acceptable pollution.
- MSAPR: when cleaner equipment became the solution
One important Canadian example is the Multi-Sector Air Pollutants Regulations, or MSAPR.
The federal regulations established emission standards for several industrial sectors and equipment types, including standards affecting nitrogen oxide emissions from industrial equipment.
In practice, meeting tougher emission limits can mean replacing older equipment, changing operating conditions or installing pollution-control technology such as catalytic reduction systems.
That is a recurring theme in air-quality work: Better regulation creates a reason to build better equipment. Then the better equipment reduces emissions.
Then monitoring and inventories can tell us whether the change actually worked.
Air pollution facts: emissions are not the same as concentrations
This is one of the most important ideas in the whole subject. Imagine two facilities:
- Facility A releases more pollution but through a tall, hot stack.
- Facility B releases less pollution through a short source near ground level.
Which facility creates the higher concentration 200 metres away? You cannot tell from the emission rate alone.
- The atmosphere has a vote.
- Wind speed matters.
- Wind direction matters.
- Atmospheric mixing matters.
- Stack height matters.
- Exit velocity matters.
- Temperature matters.
- Buildings matter.
- Terrain matters.
- Chemical reactions matter.
- Distance matters.
That's why a few air pollution facts about emissions do not automatically tell you what a neighbour will experience.
The quantity released is one part of the problem. The concentration where someone actually breathes the air is another.
So why can the air still be terrible? Here is where the optimistic story needs some hard facts. Canada's long-term improvements are real. Wildfire smoke is also real.
From 2009 to 2023, national average concentrations of NO₂ and SO₂ generally declined. VOC concentrations also declined. Ozone showed no significant national trend.
PM₂.₅ was much more erratic. In 2023, Canada's national average PM₂.₅ concentration was 62% higher than in 2009. The peak PM₂.₅ value was 167% higher than the 2009 level. The main reason was the extraordinary 2023 wildfire season.
More than 14 million hectares burned in Canada that year.
That produces a useful environmental lesson: Lower industrial emissions do not guarantee clean air every day.
Wildfires are an enormous natural source of particulate matter. And yes, this creates one awkward question...If only we could regulate wildfires. We can't.
What we can do is understand the smoke, forecast it, measure it and help people reduce their exposure.
Ozone is a different kind of problem
Ground-level ozone is particularly interesting because you usually don't release it directly from a smokestack.
It forms in the atmosphere through chemical reactions involving other pollutants in sunlight. That means reducing ozone can require controlling several precursor pollutants and understanding regional atmospheric chemistry.
Canada's national ozone concentrations have shown no significant overall trend from 2009 to 2023. That's a useful reminder that one pollutant can behave very differently from another.
Good air-quality management therefore needs more than a single pollution score.
Where does air pollution come from?
Air pollution can come from:
- Transportation - Cars, trucks, trains, aircraft and other engines.
- Industry - Combustion, processing, storage, flaring and other industrial sources.
- Agriculture - Ammonia and other emissions from agricultural activity.
- Homes and buildings - Heating, cooking, solvents, wood burning and other activities.
- Wildfires - A major source of particulate matter and other emissions.
- Natural sources - Dust, vegetation, wildland fires and other natural processes.
The mix depends enormously on where you live. That's one reason national averages can be useful for tracking progress while still telling you very little about what is happening at one particular facility or neighbourhood.
Air pollution facts: what actually works?
There is no single magic solution. The most successful approaches tend to work at several levels.
1. Prevent the pollutant: Use a cleaner fuel or process.
2. Reduce the emission: Improve combustion, capture the pollutant or install controls.
3. Design the source properly: Stack height, equipment layout and other engineering choices can influence how emissions affect the surrounding area.
4. Measure what is happening: Monitoring shows what is actually present in the atmosphere.
5. Predict what could happen: Dispersion modelling estimates concentrations under defined conditions.
6. Regulate and improve: Compare the results with applicable standards or objectives and change the design or operation when needed.
That last part is important. Rather than make a pollutant disappear, air-quality modelling helps people understand what the source is likely to do and what changes could reduce the impact.
Air pollution facts from the Calvin desk
This is where the subject becomes more practical. At Calvin Consulting Group, we are often hired to assess one or two contaminants of concern rather than every possible pollutant.
Sometimes the client tells us what to evaluate. Sometimes a regulator specifies the issue. Sometimes the source itself makes the likely contaminants fairly obvious.
- A combustion source points us toward contaminants such as NO₂ and CO.
- A sour-gas source can bring H₂S and SO₂ into focus.
- Storage and process equipment can make VOCs important.
- An odour complaint can create a different question entirely.
The first judgement is therefore often: Which contaminant actually matters here? Only then does the modelling question begin.
Air pollution facts: a flare is a good example
Flare modelling shows why air-quality work is more complicated than plugging a flow rate into software. A flare's emissions can depend on:
- gas composition
- H₂S concentration
- flow rate
- heating value
- flare geometry
- combustion efficiency
- assist gas
- operating conditions
- meteorology
Modern AERflare work can represent changing flare conditions much more realistically than older approaches. For some applications, flare emission parameters and H₂S rates can vary on an hourly basis with changing operating or meteorological conditions.
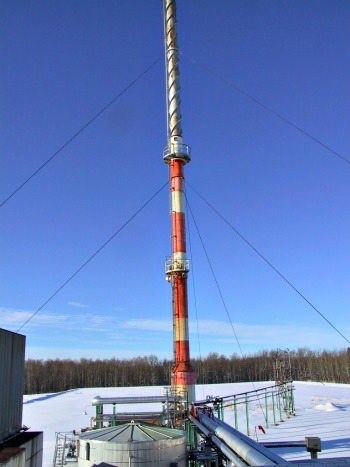 Flare stack
That allows the model to represent a facility more realistically.
It can also reveal a useful modelling truth: The operating condition with the highest emission rate does not automatically produce the highest ground-level concentration.
Plume rise and atmospheric conditions matter too. Calvin has used AERflare extensively in flare assessments and has also used CALPUFF-based approaches when there is a strong reason to do so.
We do not add complexity simply because a more complicated model exists. The physical question should justify the model.
Better data produce better modelling
One of the quiet success stories of air-quality management is better data. Alberta's Annual Emissions Inventory Reporting program provides source and emissions information from approved industrial facilities.
The federal National Pollutant Release Inventory, or NPRI, has tracked reported releases from Canadian facilities since 1993.
These datasets help regulators, consultants, researchers and the public understand where pollutants are coming from. They also make it easier to compare an unusual proposed source with similar operations.
At Calvin, these sources of information can help us check client-provided parameters.
Suppose an engineering drawing says an exhaust temperature is a certain value. We can compare it with other information.
Suppose an emission factor looks unusual. We can investigate.
Suppose a source parameter is missing. Available inventory data may help establish a reasonable estimate.
That's one reason modern modelling can be more realistic than it was decades ago. The data are better. The databases are better. The models are better. And the results can be examined by more people.
Public data can improve accountability too
The same information that helps a modeller can help the public.
NPRI data are publicly accessible. Alberta publishes air-quality and industrial-emissions information.
Ambient monitoring data are increasingly easy to access. That means a facility's environmental story does not have to remain locked inside a consultant's report.
Researchers can compare facilities. Communities can see trends. Regulators can investigate. Consultants can check assumptions. Good data are useful for everyone.
A real Calvin example
A recent Alberta gas-plant assessment illustrates the workflow.
The project evaluated NO₂ from multiple stationary combustion sources. The study included:
- engine ratings and emission factors
- stack heights and diameters
- exit velocities and temperatures
- five years of Alberta meteorology
- terrain data
- several receptor grids
- nearby industrial sources
- background NO₂ concentrations
- NOx-to-NO₂ conversion
- building downwash
- AERMOD
- regulatory statistics
The model produced the numbers. Senior Calvin review asked the harder questions:
- Do the inputs agree with the facility?
- Are the source parameters plausible?
- Does the wind pattern make sense?
- Does the terrain representation make sense?
- Why is the maximum concentration where it is?
That's the difference between operating a model and conducting an assessment.
One of our stranger air pollution facts
Most people would probably expect an Alberta environmental consultant to model oil-and-gas pollutants. We do. But Calvin once performed atmospheric dispersion modelling for a proposed Calgary radiopharmaceutical facility.
The emissions included radioactive isotopes such as carbon-11, fluorine-18, gallium-68, nitrogen-13, copper-64 and zirconium-89.
The atmospheric problem was familiar even though the pollutants were unusual:
- What was released?
- How much?
- How did it disperse?
- Where could it go?
The project included very fine receptors around hospital buildings, including intake vents and doorways, as well as nearby homes.
Calvin's role was the atmospheric dispersion modelling. Radiation specialists handled the subsequent dose assessment.
That is an important professional boundary: A good specialist knows both what they can answer and what requires another specialist.
Air pollution isn't only about health
Health is important. So is the environment. But people also care about odour, visibility and nuisance.
Hydrogen sulphide is a good example. A person can smell H₂S at a concentration far below the level at which acute toxicity becomes the concern. That creates a different kind of air-quality problem.
The question may become: Why can people smell this release? rather than: Is the concentration high enough to cause harm?
This is why a serious air-quality investigation should ask what the actual concern is before choosing the pollutant, monitor or model.
Can you model the problem yourself?
Absolutely. Learning to run an air-dispersion model is a great way to understand atmospheric science.
- You can learn what happens when the wind changes.
- You can see plume rise.
- You can explore building downwash.
- You can experiment with source strength and stack height.
- That is excellent education.
A regulatory modelling assessment is another matter as the hard part usually comes before the Run button.
A model will quite happily accept an incorrect stack height. It will calculate an answer from an inappropriate emission rate.
It will produce a beautiful concentration contour from a poorly chosen receptor grid. And it will give you a very precise answer to the wrong question.
That is why a specialist can save considerably more than modelling time.
They can help prevent the project from being built around the wrong assumptions.
How Calvin approaches air-quality problems
At Calvin Consulting Group, the approach is straightforward:
- Start with the question.
- Identify the contaminant.
- Understand the source.
- Check the data.
Choose the appropriate modelling or monitoring approach.
- Run the analysis.
- Challenge the result.
- Document the assumptions and limitations.
- Have experienced modellers perform QA/QC.
The tools change.
- AERflare gets updated.
- AERMOD gets updated.
- Emissions databases get updated.
- Regulations get updated.
The basic professional discipline remains the same: Use the best available information and be honest about what the analysis can and cannot tell you.
The bottom line
The best air pollution facts are the ones that change how you think. Yes, air pollution can harm people and ecosystems.
Yes, there are serious problems left to solve. And yes, we have already solved some remarkably large ones.
Cleaner fuels, better vehicles, industrial controls, tougher standards, improved monitoring and better data have made a substantial difference. The challenge now is to understand the problems that remain rather than assuming the old problems are still the only problems.
For a particular industrial facility, that means getting specific.
- Which pollutant?
- Which source?
- Which receptor?
- Which scenario?
- Which standard?
- Which model?
- Which data?
Those questions are where air-quality consulting begins.
Need help with air-quality modelling?
You can download a model. You can learn how to run it. You can produce a concentration map. The more important question is whether you've chosen the right problem to solve.
At Calvin Consulting Group, we help clients and engineering teams identify the contaminants of concern, characterize emissions, evaluate flare and industrial sources, develop meteorological and receptor inputs, perform dispersion modelling and review the results through senior QA/QC.
Getting that specialist involved early can save much more than the cost of a modelling run. It can save a project from having to rebuild the answer after the wrong question has already been asked.
If you have any queries, reach out to Barry at:

...to see how we can help. Go for Better data. Better modelling. Better decisions.
Clean air is our Passion...Regulatory Compliance is our Business.
Air pollution facts are more useful when you can check them
Here are some excellent places to keep exploring:
What Is Air Quality? - The basic science of sources, concentrations, monitoring and modelling.
Air Quality Statistics - What the measurements actually show.
Air Pollution by Cars - A closer look at transportation emissions.
Air Dispersion Model - How to choose the right modelling approach.
AERMOD: Alberta's Workhorse Air Dispersion Model - How AERMOD works and what experienced modellers check.
Air Quality Dispersion Modelling - The deeper technical guide.
What Is a Gas Flare? - How an important industrial source works.
Alberta Directive 060 Explained - How flaring, venting and solution-gas conservation are managed.
That is where the bigger Stuff in the Air story starts to emerge.
Search this site for more information now.
Recent Articles


-
Computers in Meteorology | How Would they Help You?
Sep 26, 26 09:40 PM
 Computers in meteorology help us keep track of atmospheric data and make predictions.
 -
Air Quality Statistics: What Do All Those Numbers Actually Mean?
Sep 21, 26 12:00 AM
 How are air quality statistics used to understand pollution, design monitoring programs, estimate emissions and make environmental decisions?
 -
Surprising Air Pollution Facts: It's Not All Bad News!
Sep 17, 26 06:14 PM
 Trying to improve air quality has been a priority. Here are some air pollution facts to show you how far we've come.


What does an air-quality modeller actually do?
This is where the computer gets a little too much credit. Suppose a client asks: What will our new facility do to local air quality? A modeller does not simply type that sentence into AERMOD.
We need to establish:
- What is being emitted?
- How much?
- From where?
- Under what operating conditions?
- Where should concentrations be predicted?
- What meteorology is representative?
- What buildings and terrain matter?
- Which contaminant should be assessed?
- Which regulatory objective or standard applies?
- Which model is appropriate?
Then comes the modelling. Then comes the part that is easiest to overlook: Does the result make sense?
Do you have concerns about air pollution in your area??
Perhaps modelling air pollution will provide the answers to your question.
That is what I do on a full-time basis. Find out if it is necessary for your project.
Have your Say...
on the StuffintheAir facebook page
Other topics listed in these guides:
The Stuff-in-the-Air Site Map
And,
Thank you to my research and writing assistants, and the author remains responsible for the content.
Air pollution facts: the six questions worth remembering
When you encounter an air-quality problem, start here:
- What is being emitted?
- How much is being emitted?
- Where does it go?
- What concentration reaches the receptor?
- What does that concentration mean?
- How do we know?
Monitoring can answer some questions.
Emissions inventories can answer others.
Dispersion modelling can fill important gaps.
Engineering analysis can change the source.
Regulation provides the framework.
Professional judgement connects the pieces.
-
The environmental story is bigger than 'pollution is bad'
One of the most useful air pollution facts is that pollution control can work.
- Lead fell dramatically.
- SOₓ emissions have fallen dramatically.
- NOₓ emissions have fallen substantially.
- Vehicle emissions are far lower than they once were.
- Industrial technology has improved.
- Monitoring has improved.
- Emission inventories have improved.
- Regulatory standards have become more demanding.
And dispersion models have become considerably more sophisticated.
The result is measurable progress. But the work isn't finished.
- Wildfires remain a huge source of PM₂.₅.
- Ozone remains stubborn.
- Some pollutants have improved much less than others.
Local sources still matter. New industrial developments still need careful assessment.
That's what makes the field interesting.

By Barry Lough, P.Met., EP (Environmental Professional)
Text copyright © 2003-2026 Stuff in the Air.com
BACK TO TOP - Hit your 'Home' Key