- Air Homepage
- Air Quality Modelling Service
- Air Quality Dispersion Modelling
- Examples of Models in Math
Examples of Models in Math: How Mathematics Predicts Air Pollution
What do examples of models in math have to do with a factory chimney? Quite a lot.
A mathematical model is a simplified representation of something complicated in the real world. Instead of trying to calculate every tiny movement of every molecule of air, we use mathematics to describe the important things we know about a system and make useful predictions.
Air pollution is a great example. Imagine a stack releasing a pollutant into the atmosphere. We want to know where that pollutant will travel, how widely it will spread and how much might reach a particular location.
We cannot watch every molecule. So we build a mathematical model.
And that leads to a more interesting question: How does mathematics turn something as messy as the atmosphere into a prediction and how do we know whether the prediction makes sense?
Mathematical Models 101
 Real-world and math models
A model is not reality. That sounds obvious, but it is one of the most important ideas in science.
A model simplifies reality enough that we can calculate something useful.The art is deciding which parts of reality matter for the question we are trying to answer.
A weather forecast is a mathematical model. A bridge-design calculation is a mathematical model. A financial forecast is a mathematical model.
Air-quality dispersion modelling is another example. The model takes information about things such as:
- how much pollutant is released;
- how fast the wind is blowing;
- how turbulent the atmosphere is;
- the height and design of the release;
- the surrounding terrain;
- where people or other receptors are located; and
- how these conditions change with time.
It then uses mathematical equations to estimate concentrations. That's one of the most useful examples of models in math because you can see the connection between the numbers and the physical world.
Start with a Plume
Consider a simple stack in an open area. Pollutant comes out of the release point. The wind carries it downwind, while atmospheric turbulence spreads it sideways and vertically.
A simplified picture looks something like this:
Source → wind → plume → receptor
The centre of the plume follows a path called the plume centreline.
As the plume travels, it spreads. In the simplest Gaussian plume representation, the horizontal and vertical spread are described by σy and σz (the σ, Greek sigma, represents a standard deviation).
You can think of them as measures of how wide and tall the plume has become. The important variables include:
- Q - emission rate, How much pollutant is being released per second by a point source (such as a stack), often expressed in grams per second (g/s).
- u - wind speed, How quickly the air is carrying the pollutant away.
- v - velocity of the stream exiting the stack (m/s).
- σy - horizontal dispersion, How widely the plume spreads sideways.
- σz - vertical dispersion, How widely the plume spreads vertically.
- H - effective release height, The height of the release after accounting for the relevant plume-rise effects.
- D (sometimes φ) - the diameter of the stack exit (m)
- T - temperature of the gas leaving the stack
- x - downwind distance, How far the plume has travelled from its source.
- y - crosswind distance, How far you are from the centreline of the plume.
- z - height above the local ground at the source, The elevation at which concentration is being calculated.

Finally, the model calculates C(x,y,z): the predicted pollutant concentration at a particular location. This is one of the simplest and most useful examples of models in math because every symbol represents something physical.

What Happens When You Change the Numbers?
This is where modelling becomes interesting. Suppose everything else stays exactly the same and the mass emission rate of the contaminant being studied increases.
You would expect the predicted concentration to increase. That statement has an important qualification: It is only straightforward when the other parameters and conditions of release remain unchanged.
That distinction matters in real modelling. A change in emission rate can occur together with changes in temperature, velocity, flow rate or other release characteristics. Those changes can affect plume rise and dispersion.
So the modeller cannot simply assume that: maximum emission = maximum ground-level concentration.
Sometimes that will be true. Sometimes it won't. That is one of the reasons we actually run the scenarios.
The Plume Is Not Just Smoke Going Downwind
Imagine a campfire. If the smoke blows directly toward you, you are likely to smell it.
Move sideways and the concentration may drop. Move farther away and the plume has had more opportunity to spread.
If the smoke rises well above your head, you may barely notice it. And if the air becomes turbulent (gusty), the smoke spreads in more directions. This makes a campfire a surprisingly good introduction to the examples of models in math used for atmospheric dispersion.
But real industrial sources are more complicated than campfires. A stack may be hundreds of times higher than the fire. Large buildings can disturb the wind. Terrain can affect air movement. Emissions can change with operating conditions. Wind speed and direction can change from hour to hour, while the stack continues to exhale.
That is where more sophisticated models become necessary.
 Mathematical models of mountain air quality
When the Simple Picture Breaks Down
A mathematical model works by making assumptions. A simple steady-state plume model might assume that meteorological conditions remain sufficiently consistent during the time the plume is being represented.
That can work well for many situations. But imagine a plume moving through a mountain valley where the wind changes direction with location and time.
Now the simple picture becomes difficult.
British Columbia's dispersion-modelling guidance describes two broad types of Gaussian dispersion approaches: straight-line plume models and curved-trajectory puff models. Straight-line models have limitations when winds vary substantially over the modelling domain, while puff models can represent meteorological conditions that vary through space and time.
This is why there is no universally best model. The right question is not: Which model is most sophisticated? Rather it's: Which model is appropriate for the question?
That is an important lesson from all the examples of models in math: more complicated mathematics is not automatically better mathematics.
Examples of Models in Math: A Model Can Be Wrong
This may sound strange. If a model is wrong, why use it? Because a useful model does not have to reproduce every detail of reality perfectly. It has to represent the important behaviour of the system well enough for the question being asked.
And a good scientific model should leave us something we can test.
Suppose an air-quality model predicts that a particular combination of emissions and weather produces the highest concentration at a particular location.
We can investigate.
- Does the result occur under identifiable meteorological conditions?
- Does the plume travel in a physically sensible direction?
- Does changing the emission rate produce a sensible response?
- Does changing the stack characteristics produce a plausible change in plume behaviour?
- Does the maximum occur where we would expect it?
If the answer looks strange, we don't simply shrug and say, The computer said so.
We investigate.
- The problem could be the model.
- It could be an input.
- It could be the way the facility was represented.
- It could be an incorrect emission rate.
- It could be the meteorological data.
- Or the result might actually be physically reasonable even though our intuition was wrong.
That process of questioning is a fundamental part of using examples of models in math responsibly.
A Model Can Run Perfectly and Still Answer the Wrong Question
This is one of the most important lessons for anyone learning mathematical modelling. A model finishing successfully does not prove that the assessment was successful.
The software can run without an error message while the modeller has:
- used the wrong emission scenario;
- omitted an important source;
- missed a receptor;
- represented a building incorrectly;
- used inappropriate terrain;
- selected unsuitable meteorological data;
- applied the wrong averaging period; or
- chosen a model that does not adequately represent the physical problem.
In other words: A technically successful model run can still produce the wrong answer. That is why professional modelling involves much more than operating software.
What an Experienced Modeller Looks For
At Calvin Consulting, modelling reports go through several levels of review. One of the questions we repeatedly ask is: Does the model represent the real situation well enough to support the conclusion? That question starts before the model is run.
We have found inconsistencies in client-supplied information.
- Sometimes the information is incomplete.
- Sometimes equipment descriptions do not agree with drawings or other records.
- Sometimes an emission rate needs to be checked against operating information, stack testing, CEMS data, flare information, historical inventories or other available evidence.
- Sometimes the problem is not the data at all.
- Sometimes the proposed design itself creates a modelling problem.
- And sometimes modelling is simply not the appropriate tool to answer the question being asked.
That is why professional judgement matters. The mathematics is important.
Knowing how to run the software is important. But deciding what should go into the model (and understanding what the result can legitimately tell you) is often the harder part.
A Real Modelling Surprise: More Isn't Always More
Here is a useful example. Suppose a flare has a high-flow condition and a lower-flow condition.
It is tempting to assume the high-flow condition must produce the highest ground-level concentration because more pollutant is being released. But the physical release conditions can change at the same time.
- A higher flow can produce greater plume rise, moving pollutant higher above the ground.
- A lower-flow condition may have less plume rise and therefore produce a higher concentration at some ground-level receptors.
Flare modelling is a particularly good demonstration of why the obvious mathematical answer is not always the correct physical answer.
 Modelling high concentrations
For blowdown flares, the situation becomes even more interesting. AERflare (special flare processing software) can divide a blowdown into three representative phases of equal released mass by default. The first two phases can occur relatively quickly, while the final tailout phase can last much longer as pressure approaches zero at the end of the release. In some cases, that long third phase can become the controlling case for a particular averaging period.
The lesson is simple: Don't guess which scenario produces the maximum impact. Understand the physics and test the scenarios.
The details of flare modelling are beyond this introductory article, but they are a particularly useful real-world example of models in math because they show how several variables interact.
What About Alberta?
Alberta uses air-quality modelling as one part of its broader air-quality management system.
AAAQOs and AAAQGs are used in a range of regulatory and air-quality-management contexts. Activities requiring an EPEA approval, operating under a Code of Practice, or otherwise subject to modelling requirements from Alberta regulators may need air-quality modelling to demonstrate their impacts relative to applicable objectives or guidelines.
For modelling, Alberta distinguishes between different assessment approaches. Such as these:

Screening can be useful when a relatively simple estimate of potential worst-case impact can answer the question. Refined modelling provides a more detailed assessment, while advanced or alternative approaches may be appropriate when particular circumstances justify them.
Most importantly: The modelling approach should follow the problem, not the modeller's favourite software.
For many conventional industrial assessments in Alberta, AERMOD is the practical refined model. Other approaches, including CALPUFF or specialized modelling tools, may be appropriate where terrain, meteorology, transport distance, chemistry, emissions or the assessment objective make them necessary.
The Government of Saskatchewan
likewise identifies AERSCREEN, AERMOD and CALPUFF as approved standard and specialized models for air-quality studies, illustrating that the basic modelling toolbox is not unique to Alberta.
British Columbia uses a three-level assessment framework:
- Level 1 Screening
- Level 2 Detailed and
- Level 3 Comprehensive
...and places particular emphasis on selecting an approach appropriate to the physical situation and the decision that needs to be made.
These provincial differences are useful context, but the underlying idea is remarkably consistent: Choose a defensible method for the question being asked.
The Philosophy of Modelling
There is a philosophical idea hiding inside all these examples of models in math:
- A model is useful because it simplifies reality without losing the parts that matter to the question.
- We know that our information is incomplete.
- We know that atmospheric turbulence cannot be described perfectly.
- We know that emissions may vary.
- We know that terrain and buildings can complicate air movement.
- We know that measurements and historical meteorological data have limitations.
- So modelling involves uncertainty from the beginning.
 Keep errors to a minimum
Rather than pretend that uncertainty doesn't exist, the professional response is to identify it, understand it, reduce avoidable errors even and explain what the results do (and do not) demonstrate.
That is why good modelling is not simply about producing the biggest or smallest number as much as it is about producing a defensible answer to a well-defined question.
So, What Are the Examples of Models in Math?
Air-quality dispersion models are just one member of a very large family. A weather model uses mathematics to represent the atmosphere.
A structural model represents forces and stresses in a building or bridge. An economic model represents relationships between prices, production and demand.
A climate model represents interactions among the atmosphere, oceans, land and other parts of the Earth system. A dispersion model represents how contaminants released into the atmosphere are transported and dispersed.
In every case, the same fundamental lesson applies:
- Reality is complicated.
- A model simplifies it.
- Mathematics makes the simplified system calculable.
- The result is a prediction.
- The prediction must then be examined critically.
That is what makes these such useful examples of models in math.
When Is It Better to Call a Specialist?
A simple mathematical model can be an excellent learning tool. A regulatory air-quality assessment is something else.
Once the result may influence an approval, facility design, emission limit, setback, operating condition, emergency plan or significant expenditure, the important questions are no longer simply:
Can I make the model run? They become:
- Am I modelling the right thing?
- Are the inputs complete and defensible?
- Is this the appropriate model?
- Have I represented the important physical effects?
- Could another modeller reproduce and challenge my conclusion?
That is where specialist experience becomes valuable.
 Modelling air emissions
At Calvin Consulting Group Ltd., we work with AERMOD, AERflare, CALPUFF, ABflare and other modelling tools for industrial facilities across Western Canada. Our work includes emissions, meteorology, terrain, receptors, building downwash, cumulative sources, flaring, unusual operating conditions and regulatory applications.
We also question the modelling when the modelling itself is the problem.
Sometimes the right answer is a more detailed model. Sometimes it is better source data. Sometimes it is a different scenario. Sometimes an important design change should happen before modelling continues.
And sometimes the existing assessment already answers the regulatory question, so additional modelling is unnecessary. Most clients like this one.
That is the value of having an experienced modeller involved early. The software can calculate the answer. The harder part is knowing what question to ask it.
Contact Barry at Calvin Consulting Group Ltd. to discuss an air-quality modelling question or review a proposed assessment.

Let's discuss your specific needs and breathe a sigh of relief knowing you're in good hands. A healthy future depends on clean air.
Clean air is our Passion...Regulatory Compliance is our Business.
Learning More
This page is the 101 introduction. The details deserve their own explanations.
Explore:
- What Is a Receptor? Why the model only calculates concentrations where you tell it to.
- AERMOD vs. CALPUFF and how model selection depends on terrain, meteorology, distance and the assessment objective.
- Building Downwash and BPIP — what happens when a building gets in the way of a plume.
- How Meteorology Affects Dispersion — why the same emissions can produce very different concentrations under different weather conditions.
- Method of Variation of Parameters — how changing emissions and release conditions can change the predicted maximum.
- Particulate Matter in Air-Quality Modelling — why PM₂.₅, PM₁₀, TSP, particle size and deposition require careful treatment.
- Secondary Pollutants — what happens when pollutants form or change in the atmosphere after they are emitted.
- Acid Deposition — how atmospheric chemistry connects emissions, transport and deposition.
Recent Articles


-
Aermod Model and Environmental Breakthroughs.
Oct 09, 26 10:28 PM
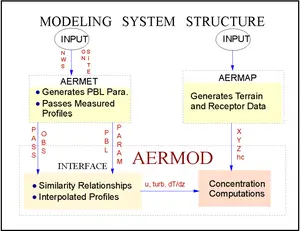
 How the aermod model uses terrain and meteorological analysis (AERMAP and AERMET) to predict pollutant spread, and how ISC3 fails to do so.
-
Gas Flare Output SO2 – How to control it.
Oct 04, 26 06:37 PM
 What's the best way to handle temporary flaring and its output SO2? In Directive 60, the Alberta Energy Regulator (AER) gives guidance.
-
Natural Gas Leak Detection: Does YOUR Facility Need it?
Sep 28, 26 08:40 AM
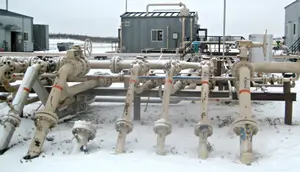
 It's important for industries, especially in the energy sector, to have a natural gas leak detection program. It's often required by law.
The Modeller's Reality Check
Before trusting a result, an experienced modeller should be asking questions such as:
- Does the source representation make sense? Are the emission rates, release characteristics and operating scenarios realistic and complete?
- Does the meteorology make sense? Do the winds, temperatures and atmospheric conditions produce plausible results?
- Does the terrain make sense? Are important hills, valleys and elevation changes represented adequately?
- Does the receptor network make sense? Did we actually ask the model to calculate concentrations where they matter?
- Does the building representation make sense? Could structures alter plume behaviour in a way that the model needs to represent?
- Does the maximum make sense? Is the location and meteorological condition associated with the maximum physically plausible?
- Does changing an input produce a sensible response?
This last one is especially important. If changing a parameter produces a surprising result, don't automatically assume the model is wrong.
But don't automatically assume the result is right, either.
Investigate. That habit of constructive doubt is one of the most useful skills in mathematical modelling.
Do you have concerns about air pollution in your area??
Perhaps modelling air pollution will provide the answers to your question.
That is what I do on a full-time basis. Find out if it is necessary for your project.
Have your Say...
on the StuffintheAir facebook page
Other topics listed in these guides:
The Stuff-in-the-Air Site Map
And,
Thank you to my research and writing assistants, and the author remains responsible for the content.
What Does an Air-Quality Modeller Actually Do?
A modeller's job isn't simply to press Run. It starts with the question: What do we need?
Then comes the facility. What is being released? How much? Under what operating conditions?
Then the surroundings...What does the terrain look like? Where are the receptors? Are there buildings or other sources that matter?
Then the atmosphere. What meteorology is representative?
Finally, the modeller decides how those pieces should be represented mathematically. The software does the calculations. The modeller has to decide whether those calculations answer the question.
That distinction is one reason professional air-quality modelling can be considerably more complicated than it looks from the outside.
Most Popular Pages on this Website:
Pictures of Global Warming
- See photos, cartoons, charts, graphs and a few surprises.
Clouds
- Don't know a cumulus from a stratus? Check here.
Causes of Global Warming
- It's not always obvious.
Calgary Alberta Weather
- Example of Canadian Goodness.
Thermometers
- Our favourite weather instrument.
- Home
- Contact Us
- Free E-zine Back Issues
- Privacy Policy
- Site Map - I'll help find something good.

By Barry Lough, P.Met., EP (Environmental Professional)
Text copyright © 2003-2026 Stuff in the Air.com
BACK TO TOP - Hit your 'Home' Key