- Air Homepage
- Weather Maps
- Forecast Future Weather
Discover how Meteorologists forecast future weather
Meteorologists forecast future weather using a variety of principles. One of the most important is advection.
Find more about meteorology.
Did you ever wonder how meteorologists predict that sunny afternoon will suddenly turn into a thunderstorm? Learn how forecasters map the invisible flow of heat and cold that dictates your future weather using the powerful secret of "advection." Here's a guide to weather forecasting's hidden engine
You're fascinated by weather forecasts. Meteorologists use complex mathematical models to predict weather patterns that may intrigue anyone. On its own, data collection and analysis are interesting. Even just the technology behind data collection and analysis fascinates us.
Weather Forecasting: Step-by-Step
What is the process by which meteorologists forecast future weather? Weather forecasts are based on observational data, computer models, and scientific knowledge of atmospheric processes. Here's how it works:
- Meteorologists collect data from lots of sources, including weather stations, satellites, radar systems, and balloons. The data includes temperature, humidity, air pressure, wind speed and direction, cloud cover, and precipitation.
- Meteorologists analyze the collected data to identify weather patterns, like high- and low-pressure systems, fronts, and other atmospheric features. In order to understand the current state of the atmosphere, they analyze the data for patterns and trends.
- Meteorologists simulate the behavior of the atmosphere with sophisticated computer models called numerical weather prediction (NWP). The models predict how the atmosphere will change over time using mathematical equations that represent the laws of physics.
- Meteorologists input the analyzed data as the initial conditions for computer models. The model starts with these initial conditions. Models simulate how temperature, pressure, humidity, and wind interact with atmospheric variables to predict weather patterns.
- The models divide the atmosphere into a three-dimensional grid, and calculate each grid point. Models go through a series of time steps, each representing a small increment of time (e.g., an hour). At each time step, the calculations are repeated.
- Computer models predict weather variables like temperature, precipitation, wind speed and direction, cloud cover, and atmospheric pressure. Longer forecast periods mean less accuracy, since the forecast period extends several days into the future.
Online weather services and apps are usually the easiest way to get weather forecasts anywhere. Here are some popular sources:
- Weather forecasts are provided by national meteorological services in most countries. Users can access localized forecasts on these services' websites or apps.
- Several private weather companies offer weather forecasting services. Forecasts from these companies are usually more detailed and specialized, aimed at specific industries or users. They usually have weather apps or websites.
- Smartphone apps help you get weather forecasts on your phone. Most of these apps have user-friendly interfaces, customizable features, and localized forecasts.
- There are a lot of weather websites out there. Examples include Weather.com, AccuWeather, and The Weather Channel. Websites like these provide detailed forecasts, radar and satellite images, and other weather info.
The kinetic concepts are quite simple.
Advection can affect weather in many ways, such as cooling the air, bringing in clouds, and bringing moisture. Advection is when air from one area moves to another area, and can cause changes in temperature and weather.
Also, advection moves moist air into a place with drier air, or drier air moves into a place with more moist air. This can change the amount of rain and the amount of humidity in the air.
Meteorology uses advection to explain many of the changes in weather patterns that happen every day. Meteorologists can make better forecasts by studying advection.
What do I mean?
The wind blows. It might carry a cloud of dust or smoke across the sky. It can also carry warm or humid air, or air defined by some other attribute. That is the process of advection.
Weather is forecasted by advection of gradients over the short term. Gradients are abrupt changes in temperature or other properties over a short distance. For example, they're near warm or humid air masses and fronts.
When a front passes over, what happens? As Bob Dylan once said… The Times They are a-Changin'
…at least they are when a gradient moves across your region.
Since frontal advection is a process in weather forecasting that describes how air moves between two different areas of air with different temperatures, humidities, and densities, this helps us predict a change in the weather.
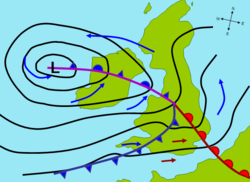
A weather map can show frontal advection with different symbols and colors to show the direction and intensity of the air flow. On one type of surface weather map, a warm front is shown as a line with semicircles pointing in the direction of movement, while a cold front is shown as a line with triangles pointing in the direction of movement. It can also indicate the type of air mass involved (warm or cold) and the intensity of the advection by the colors.
Using a Numerical Weather Forecasting map to interpret the predicted movement of fronts:
Meteorologists forecast frontal advection using numerical models, satellite and radar data, and ground-based observations to track the movement of air masses and predict how they'll interact. By analyzing temperature, humidity, and wind patterns in the atmosphere, they can predict precipitation, thunderstorms, and other weather events associated with frontal advection. Weather forecasts and warnings are then created based on this information. In a nutshell...
When do we have advection, to forecast future weather changes?
It's easier to tell when we don't.
- No wind,
- No gradient, or
- Wind blows across rather than along the gradient,
...and cannot move it. As math geeks would say, the dot product is zero. That's the dot product between velocity and gradient.
Then it's easier to forecast the weather. Predict little or no change in the near future, since the contours are nearly parallel. Thus nothing's really happening at the moment.
What contours?
The upper winds are advecting the front in this picture.
Take a look at a weather map used to forecast future weather. As a result of the pressure, the upper wind field looks like concentric curves or swirls called isopleths. An isopleth is a line on a map connecting points of equal value, such as equal population density or equal temperature
The temperature field, if that's what we're looking at, would be represented by set of isopleths called isotherms. They'd surround a nearby spot.
A gradient shows a direction and rate of change in a variable, such as a change in temperature or pressure. Think of the temperature gradient as an arrow cutting straight across the isotherms and pointing downstream. In this case, you'd expect the two contours to cross at several points.
To help you visualize this, sketch two bulls eye patterns near each other on scrap paper as a science project idea. Maybe something like this:
There should be a few small-area parallelograms, little four-sided boxes, where the lines cross in some areas. And many in other areas. See the variety of box sizes in the representation above?
Advection is stronger when these so-called solenoids are smaller on the weather map. In this example, the temperature will change faster. When this happens, the weather can be spectacular. It's possible to get severe weather when there's high winds or storms.
Is it getting warmer or colder? Check the wind contours upstream to see if the incoming air is warmer or colder (i.e., which side of the front). Remember, high pressure pressure centers have clockwise wind flow, and low pressure centers have counterclockwise wind flow (if you're north of the equator).
Go back from Forecast Future Weather to the Forecast Map Weather webpage.
If you're looking for weather forecasts anywhere, choose a reputable and reliable source. Private weather companies and mobile apps can also provide reliable forecasts, but national meteorological services are usually the most accurate and up-to-date.
#23
Search this site for more information now.
What does a Meteorologist Do?
This is one of the introductory approaches to forecast future weather. Simply sliding air features across the map.
Do you have concerns about air pollution in your area??
Perhaps modelling air pollution will provide the answers to your question.
That is what I do on a full-time basis. Find out if it is necessary for your project.
Have your Say...
on the StuffintheAir facebook page
Other topics listed in these guides:
The Stuff-in-the-Air Site Map
And,
Thank you to my research and writing assistants, ChatGPT and WordTune, as well as Wombo and others for the images.
OpenAI's large-scale language generation model (and others provided by Google and Meta), helped generate this text. As soon as draft language is generated, the author reviews, edits, and revises it to their own liking and is responsible for the content.


New! Comments
Do you like what you see here? Please let us know in the box below.