- Air Homepage
- Air Quality Modelling Service
- Air Quality Modeling
- How Nitrogen Dioxide Is Formed
How Nitrogen Dioxide Is Formed and How We Model It
Nitrogen dioxide (NO₂) is one of the most important pollutants considered in industrial air-quality assessments. The complication with how nitrogen dioxide is formed is that much of the NO₂ near an industrial source may not leave the stack as NO₂.
 Nitrogen and ozone here?
Combustion equipment typically emits nitrogen oxides (NOₓ), consisting primarily of nitric oxide (NO) and smaller amounts of NO₂. After release, NO can react with ozone and other atmospheric constituents and become NO₂.
That creates an important modelling problem: If a facility emits NOₓ, how much NO₂ should the dispersion model predict at ground level? The answer depends on the source, the atmosphere, the available data and the regulatory methodology being used.
A technically correct NOₓ model can still produce an inappropriate NO₂ assessment if the conversion method, in-stack ratio, ozone data or operating scenario is poorly chosen.
For me, the first questions are:
- What is actually being emitted?
- What proportion is already NO₂?
- How much atmospheric ozone is available?
- How far is the plume travelling before the maximum concentration occurs?
- What does the applicable regulator require?
This page explains how nitrogen dioxide is formed and how NOₓ-to-NO₂ conversion is handled in Alberta, British Columbia and Saskatchewan.
How nitrogen dioxide is formed
Nitrogen dioxide can come directly from combustion sources, but much of the atmospheric NO₂ associated with combustion emissions develops after the plume leaves the stack.
A simplified version of the process is:
Combustion → NOₓ emission → atmospheric dispersion → chemical conversion → NO₂
The atmosphere matters because the chemistry does not occur instantly or at a constant rate.
A plume released into an atmosphere containing substantial ozone may convert NO to NO₂ differently from one released under low-ozone conditions. Meteorology, dilution, travel time and source characteristics all influence the result. That is why NO₂ modelling is not simply a matter of multiplying NOₓ by a fixed percentage.
Where does NOₓ come from? Common sources include:
- natural-gas engines and turbines
- boilers and heaters
- furnaces
- industrial combustion equipment
- vehicles
- power generation
- other high-temperature combustion processes
Natural processes also produce nitrogen oxides, including lightning and biological activity, but industrial dispersion assessments are generally concerned with the emissions associated with the facility and relevant background concentrations.
Why do we care about NO₂? NO₂ is important because elevated concentrations can affect human health and contribute to atmospheric chemistry, including the formation of other pollutants.
For industrial permitting, however, the immediate practical question is usually more specific: Will predicted ground-level NO₂ concentrations remain below the applicable air-quality objective or standard?
Why NOₓ-to-NO₂ conversion matters in dispersion modelling
AERMOD and other dispersion models can calculate where the emitted NOₓ goes, but the modeller still has to determine how that NOₓ should be represented as NO₂.
 Meteorological precision and NO2
This is where several accepted approaches come into play.
Total Conversion - The simplest and most conservative approach is to assume that all NOₓ becomes NO₂. This produces the highest possible NO₂ concentration for the modelled NOₓ emission and is therefore a useful screening test.
In Alberta, this approach is particularly useful as a first step. If the predicted NO₂ concentration meets the applicable objective using Total Conversion, there may be no reason to introduce a more complicated conversion method. That can sometimes save considerable modelling effort.
ARM and ARM2 - The Ambient Ratio Method (ARM) uses observed relationships between NOₓ and NO₂. ARM2 is a more developed version based on empirical data and is intended to provide a more realistic estimate of the NO₂/NOₓ relationship under appropriate conditions.
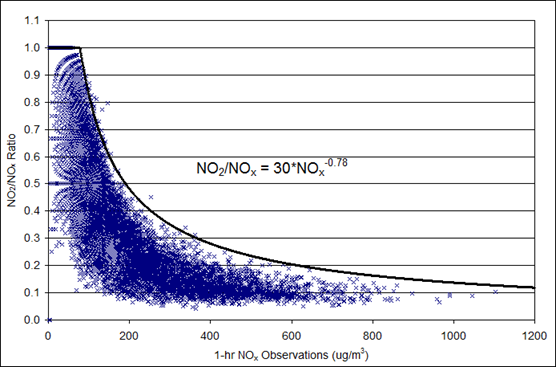 The Ambient Ratio Method (ARM) uses empirical data
The advantage is that it can be less conservative than assuming 100% conversion. The trade-off is that the method depends on suitable data and appropriate application.
OLM - The Ozone Limiting Method (OLM) uses ambient ozone to determine how much NO can realistically be converted to NO₂. The concept is intuitive:
NOₓ + available ozone → potential NO₂ formation
If insufficient ozone is available, complete conversion cannot occur simply because enough NOₓ was emitted.
PVMRM - The Plume Volume Molar Ratio Method (PVMRM) also considers ozone availability, but incorporates the volume of the plume and the mixing of emitted NOₓ with ambient air. PVMRM is particularly useful for elevated point sources and is incorporated directly into AERMOD.
In Alberta, PVMRM is often the preferred refined approach, and one reason is practical as well as technical: suitable background ozone data are readily available and already have it formatted for use in the modelling. That makes a properly configured PVMRM assessment relatively convenient without requiring every project to establish a new ozone monitoring program.
Alberta's approach begins with a useful principle...
Don't add complexity until you need it. The 2021 Alberta Air Quality Model Guideline uses a tiered approach to NO₂ modelling.
Start with Total Conversion - For a conservative screening assessment, all NOₓ emissions are assumed to become NO₂.
If the resulting predicted NO₂ concentrations comply with the applicable AAAQOs, additional NO₂ conversion modelling may not be necessary. If they do not, a less conservative and potentially more representative approach can be considered.
PVMRM is commonly the next step - For refined Alberta assessments of how nitrogen dioxide is formed, PVMRM is commonly used with AERMOD. Important inputs can include:
- the NOₓ emission rate
- the in-stack NO₂/NOₓ ratio
- background ozone concentrations
- source characteristics
- meteorological conditions
- receptor locations
- surrounding sources
Where source-specific in-stack information is unavailable, the Alberta methodology provides default approaches. This is one of the places where professional judgement becomes important. A default value may be acceptable, but that does not automatically make it the best value for every project.
Example of the practical approach - For one Alberta gas-plant assessment, the objective was to determine whether NO₂ from stationary combustion equipment would comply with the applicable AAAQOs. The assessment used:
- AERMOD
- five years of AEPA WRF meteorological data
- AERMET processing
- elevated terrain
- building-downwash analysis using BPIP
- nearby industrial sources
- three years of recent background NO₂ monitoring data
- PVMRM for NOₓ-to-NO₂ conversion
 Rugged terrain maximizes plume impact
Because source-specific in-stack NO₂/NOₓ information was unavailable for the combustion equipment, an ISR of 0.2 may be used. Site-specific ozone data are also often unavailable, so rural background ozone data from the Alberta guideline can be used.
The resulting one-hour and annual NO₂ concentrations, including background, were below the applicable AAAQOs. The important point is not simply that the project passed in this case. An assessment of how nitrogen dioxide is formed like this requires a chain of decisions:
source emissions → meteorology → background NO₂ → in-stack ratio → ozone → PVMRM → building effects → neighbouring sources → ground-level concentrations
That is what makes NO₂ modelling a scientific assessment rather than a software exercise.
How British Columbia approaches NO₂ modelling
British Columbia provides particularly detailed guidance for NO₂ modelling. That makes the BC approach useful for understanding how nitrogen dioxide is formed and the range of methods available and the circumstances in which greater sophistication may be justified.
The BC framework discusses methods including:
- Total Conversion
- ARM
- ARM2
- OLM
- PVMRM
It also provides detailed guidance regarding:
- ambient ozone datasets
- NO₂ background concentrations
- in-stack NO₂/NOₓ ratios
- source characteristics
- urban versus rural settings
- model performance evaluation
- QA/QC
- justification of modelling methods
One of the strengths of the BC guidance is the amount of information available to help the modeller choose among these approaches.
Why BC can require more thought - NO₂ modelling becomes particularly interesting where:
- several sources interact
- ruban concentrations are important
- ozone varies significantly
- source characteristics differ
- monitoring data are limited
- complex terrain affects plume travel
The BC guidance also discusses comparison of model predictions with monitored concentrations using tools such as frequency statistics, Q-Q plots, time-series analysis, bias and error measures.
For more advanced assessments, the modeller may need to demonstrate not only that the model was run correctly, but that the selected methodology performs reasonably against observed conditions. That is a considerably more demanding standard than simply reporting a modelled maximum.
How Saskatchewan approaches NO₂ modelling
Saskatchewan also uses a progression from conservative assumptions toward more refined NO₂ conversion methods to determine how nitrogen dioxide is formed. Total Conversion provides a conservative starting point.
If the resulting concentrations indicate potential exceedances, methods such as ARM2, OLM or PVMRM may provide a more representative estimate, depending on the source and available information. The Saskatchewan guidance also emphasizes:
- background ozone
- in-stack NO₂/NOₓ ratios
- source characteristics
- appropriate selection of conversion methods
- limitations of different techniques
The practical lesson across the western provinces is remarkably consistent: Use the simplest defensible approach that answers the regulatory question.
What an Alberta NO₂ assessment actually looks like
A typical Alberta assessment begins with the facility itself. Suppose a gas plant contains engines, turbines, heaters, reboilers and other stationary combustion equipment. The modeller first determines:
What are the sources? For each source, information such as the following may be required:
- equipment rating
- emission factor
- NOₓ emission rate
- stack height
- stack diameter
- exhaust velocity
- exhaust temperature
- release orientation
- building dimensions
The surrounding environment then has to be represented. That can include:
- five years of meteorological data
- terrain
- nearby industrial sources
- background NO₂
- receptor grids
- building downwash
Only then does the NOₓ-to-NO₂ conversion become meaningful.
 Advanced plume analysis
A real-world example - of how nitrogen dioxide is formed: In one recent Alberta assessment, the highest predicted one-hour project NO₂ concentration was 87.1 µg/m³.
A background concentration of 8.8 µg/m³ was added, giving a total of 95.9 µg/m³. The applicable one-hour AAAQO was 300 µg/m³.
For the annual averaging period, the predicted project concentration was 8.7 µg/m³, and the background concentration was 3.7 µg/m³, giving a total of 12.4 µg/m³ compared with an annual AAAQO of 45 µg/m³.
Both results were below the applicable objectives. The assessment therefore answered the regulatory question: Could the facility operate as proposed without exceeding the applicable NO₂ objectives?
Yes.
Calvin Consulting Group Ltd.
Calvin Consulting works with industrial clients across Canada on air-quality assessments involving NOₓ, NO₂, combustion equipment, flaring, emergency releases and complex operating scenarios.
Our work includes AERMOD assessments using Alberta's accepted NO₂ methodologies, including PVMRM where appropriate. Our experience includes:
- five-year site-specific and regulatory meteorological datasets
- AERMET processing
- background air-quality assessment
- NOₓ emission inventories
- in-stack NO₂/NOₓ ratio evaluation
- ozone data preparation
- PVMRM, ARM2 and other accepted NO₂ approaches
- building-downwash analysis
- cumulative modelling
- regulatory reporting
We have also trained personnel from Alberta Environment and Protected Areas, the Alberta Energy Regulator and Environment and Climate Change Canada in air-quality modelling.
Most importantly, we do not assume that every project needs more modelling. We first determine what the regulatory question actually is, what information is already available and which modelling approach provides a defensible answer.
Before commissioning another NO₂ assessment, let's determine what actually needs to be modelled. Contact Barry at Calvin Consulting Group Ltd. to discuss your project.

With Calvin Consulting, you get more than just a report; you get peace of mind knowing every detail has been addressed. You can rely on us for complex air quality assessments.
Clean air is our Passion...Regulatory Compliance is our Business.
Why Nitrogen Dioxide Modelling Is More Than a Conversion Factor
The chemistry is important, but the larger lesson is broader. An expanded chain of air-quality modeling connects:
combustion → NOₓ emissions → atmospheric chemistry → dispersion → ground-level NO₂ → regulatory decision
Every link in this chain matters. A technically sophisticated model with poor emission data can produce a poor answer. A conservative model may provide exactly the information a regulator needs.
A more refined model may be worthwhile when it materially changes the assessment. The modeller's job is to know the difference.
Recent Articles


-
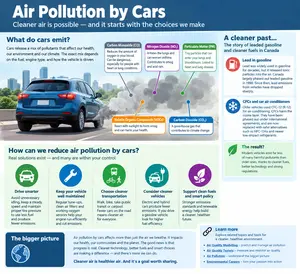
Air Pollution by Cars: Don't Breathe Too Deeply!
Oct 15, 26 03:07 PM
 Air pollution by cars is a big problem. Carbon monoxide is one of the major pollutants cars emit, but smarter use could reverse it.
 -
Environmental Impact Assessment: Work to do on air quality
Oct 14, 26 10:46 AM
 Before going ahead with industrial development, you need some research. The preliminary work would include an environmental impact assessment, market and economic analyses etc.
 -
Expert Judgement: How do You Apply it to Air Quality?
Oct 11, 26 12:55 AM
 More and more model input decisions require expert judgement as models get more complex. A primer on some of CALPUFF's advanced variables

What I look for when reviewing NO₂ modelling
This is where experience matters more than simply knowing the software options.
What I check first:
1. What is actually being emitted? - I want to know whether the NOₓ emission rate is based on an appropriate emission factor, manufacturer data, stack testing, engineering calculations or another defensible source.
2. What is the in-stack NO₂/NOₓ ratio? - A default ratio may be appropriate, but source-specific information can be better when it exists.
3. Is the ozone dataset representative? - PVMRM depends on ozone. The question is not simply whether an ozone dataset exists, but whether it reasonably represents the location and conditions being modelled.
4. Where does the maximum occur? - A maximum concentration has a location and usually a meteorological explanation. I want to know why the maximum occurs there.
5. Does the result make physical sense? - If a small change to stack temperature, flow or source configuration produces a large change in NO₂ concentrations, I want to know why.
6. Are nearby sources being handled properly? - A project can look compliant when important neighbouring combustion sources have been overlooked.
7. Is the chosen method necessary? - There is a tendency in modelling to assume that a more sophisticated method is automatically better. It isn't.
A simpler method may be preferable when it is conservative, defensible and answers the regulatory question.
My rule of thumb: don't use a more complicated NO₂ conversion method simply because it exists. Use it when it provides information that matters.
Do you have concerns about air pollution in your area??
Perhaps modelling air pollution will provide the answers to your question.
That is what I do on a full-time basis. Find out if it is necessary for your project.
Have your Say...
on the StuffintheAir facebook page
Other topics listed in these guides:
The Stuff-in-the-Air Site Map
And,
Thank you to my research and writing assistants, and the author remains responsible for the content.
Do You Actually Need More NO₂ Modelling?
Not necessarily. Before starting another modelling exercise, I ask:
- Has the facility actually changed?
- Have the NOₓ emissions changed?
- Has the equipment changed?
- Has the operating scenario changed?
- Does the existing assessment already answer the regulatory question?
- Would a different conversion method materially change the decision?
Sometimes the correct answer is new modelling. Sometimes it is a revised emission scenario. Sometimes the existing assessment is already sufficient.
The most expensive modelling exercise is often the one that answers a question nobody needed answered.
Most Popular Pages on this Website:
Pictures of Global Warming
- See photos, cartoons, charts, graphs and a few surprises.
Clouds
- Don't know a cumulus from a stratus? Check here.
Causes of Global Warming
- It's not always obvious.
Calgary Alberta Weather
- Example of Canadian Goodness.
Thermometers
- Our favourite weather instrument.
- Home
- Contact Us
- Free E-zine Back Issues
- Privacy Policy
- Site Map - I'll help find something good.

By Barry Lough, P.Met., EP (Environmental Professional)
Text copyright © 2003-2026 Stuff in the Air.com
BACK TO TOP - Hit your 'Home' Key