- Air Homepage
- Alberta Air Quality
- How to Check Data Quality
Learn how to check data quality with precision
Learn how to check data quality with Alberta's AMD, Chapter 6. This comprehensive guide takes you through amendments, project-specific documents, and field records needed for credibility.
The Science of Ambient Data Quality and AMD Chapter 6 - Is your data credible if it doesn't meet Alberta's strict 75% completeness rule or if you store raw and validated files together? Make sure your ambient air quality data is flawless by learning the essential practices for datalogger scan rates, wind calculations, and archiving.
If you need techniques for data collection, scan rates, averaging intervals, statistics and output verification this is a good place to start. Understand the importance of preserving data integrity as you proceed with data management.
Quality assurance and compliance depend on keeping raw and validated data separate. See the portion of Chapter 6 on data validation. This article will help you manage data quality better. Get in touch with the company below if you want help improving your data monitoring.
1.0 What This Chapter is for
The "Ambient Data Quality" document, which is part of Alberta's Air Monitoring Directive (AMD), explains how continuous ambient air quality and meteorological data are collected and ensured to be accurate. Maintaining data quality is the goal. Follow these rules if you're collecting data. Chapter 9 of the AMD has details on reporting and it provides a methodical, comprehensive framework for reporting air quality data. Here's a brief summary.
Ch 9 covers Industrial Reporting and Alberta Airshed Reporting, including:
- Data submissions like ambient air monitoring and emissions data,
- Figures that simplify complicated steps on roles, responsibilities, and data submission processes,
- Standards for unit conversions, calibration, and metadata to help ensure data quality.
- Guidelines third parties must follow to maintain data integrity, certifiers, preparers, contractors,
- Data standards and regular reporting instructions to ensure high-quality, actionable environmental data.
1.1 The amendments
The document has been updated twice:
- The document's design and branding changed in August 2016.
- The title page was updated in December 2016, specifically removing the 1989 AMD reference.
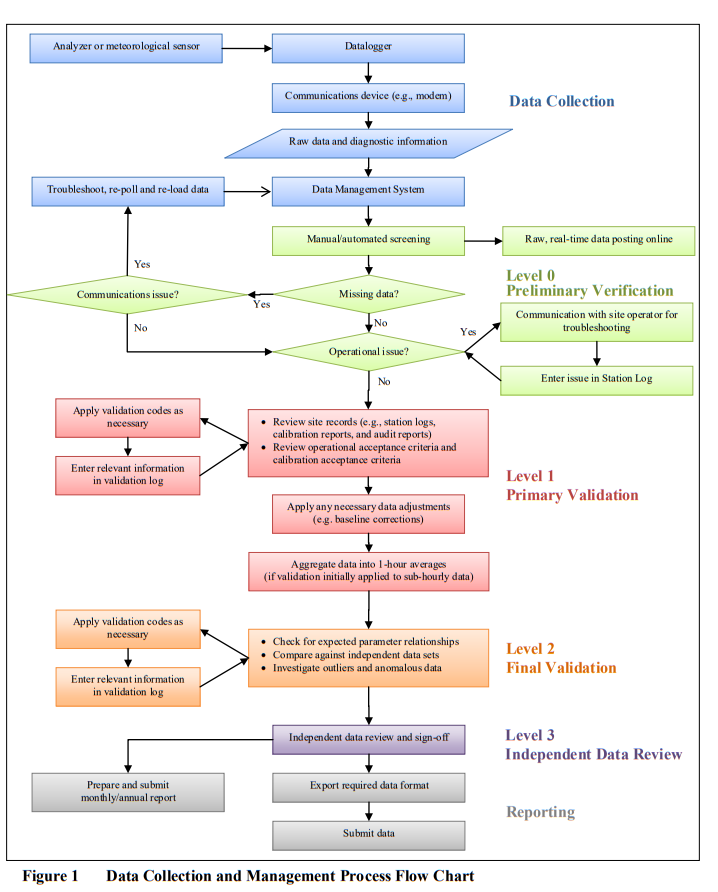
Here's a flow chart of how data collection and management should work. In the AMD, the Reporting Chapter (Chapter 9) describes the data reporting process.
 An overview of data gathering and management
The flow diagram is just a guideline and may not cover every category of information needed in monthly or quarterly industrial reports. Requirements are specified in AMD Reporting Chapter, plant approval documents, and Director notices. Despite being helpful, the diagram doesn't cover everything. Ensure all reporting clauses and plant approval requirements are met before you prepare reports.
2.0 Documents and records
Documents and records were previously outlined in Chapter 5 of the Air Monitoring Directive. Documents and records must meet minimum standards. It's best to keep these documents and records in a place where they can be easily accessed and preserved for a long time.
 Keep the place beautiful with clean air
2.1 Documents specific to the project
Certain documents are needed to maintain continuous ambient data quality. Data collection, verification, validation, and reporting procedures are included in these documents. They're important parts of the Quality Assurance Plan (QAP) created by the person responsible. Standard Operating Procedures (SOPs) should cover how to check data quality, collect data and ensure its accuracy and reliability.
2.2 Records in the field
It's crucial to keep field records for continuous ambient air monitoring. Records should include information about the monitoring station, like instrument maintenance, quality checks, troubleshooting, site visits, and any other relevant data. These records include station logs, which are chronological records of activities at the site.
To make the data validation process easier, keep these records in an electronic or web-based system. They are an important part of how to check data quality and help track the technician's activities, equipment details, maintenance actions, and performance. Monitoring data is accurate and reliable this way.
3.0 Data collection and management: How to check data quality
Data collection is gathering information, while data management is organizing, storing, checking, and reporting that data. It's like getting the facts, then making sure they're accurate and well-organized.
3.1 Collecting data
Data collection is gathering information, while data management is organizing, storing, checking, and reporting that data. It's like getting the facts, then making sure they're accurate and well-organized.
 Keeping track of things
3.1.1 Scan rates for dataloggers
For weather-related measurements like temperature, humidity, and such, use 1-second scan rates. Make sure the scan rate is at least as fast as the instruments can provide data for things like gases and particles. Dataloggers check and record the instrument's readings at scan rates. So, for some measurements, do it really fast, like every second, and for others, do it as fast as the instrument can.
3.1.2 Intervals for averaging data
The deal with data averaging intervals is this:
- Data scanned is raw, unaveraged measurements collected by a datalogger.
- How often you average these raw data depends on the datalogger scan rate.
- For quality control data, start with a 1-minute interval.
- You should include at least 75% of the scanned data in your base averages.
- Keep final averages, which should be less than or equal to 1 hour. At least 75% of the base averages need to be included.
- You usually report hourly averages, but you can use shorter intervals for validation.
Follow the data retention rules in the Quality System Chapter.
3.1.3 Wind direction standard deviation
Let's talk about the standard deviation of wind directions:
- In atmospheric dispersion modeling, it's a fancy math thing. It helps figure out how pollutants spread.
- Wind direction is circular (think compass directions), not straight like most numbers. Calculating its standard deviation isn't as easy.
- For calculating this, the US Environmental Protection Agency (EPA) has guidelines, and modern dataloggers use the Yamartino method.
- Unless the Director has approved a different method, you should collect hourly averages of wind direction standard deviation using the EPA-approved method.
You have to calculate the standard deviation externally if you don't have those hourly values.
3.1.4 Verification of analog output
Here's how Analog Output Verification works:
- Datalogger data must match digital data from the analyzer, especially when you start monitoring and after any system changes.
- Do periodic checks (like once a month) to catch any time drifts.
- It's sometimes necessary to adjust the time associated with the sample.
It's important to remember that analog and digital data can have different time stamps, especially when instruments have a delayed response. You should write down your Quality Assurance Plan (QAP) and Standard Operating Procedures (SOPs) if you use specific methods to fix the time difference.
Analog data collection can be tricky for certain instruments, like the Beta Attenuation Monitor (BAM), Tapered Element Oscillating Microbalance (TEOM) and continuous Gas Chromatography (GC).
3.2 Data management
Continuous ambient air monitoring involves preserving raw data's integrity. This includes keeping records like data flags, instrument diagnostics, data verification outcomes, and calibration results. There's a requirement (DQ 3-H) for the person in charge to archive raw data separately and distinctly from validated data collected from monitoring stations. Quality assurance and compliance depend on this separation.
Where to go next?
At Calvin Consulting Group Ltd., we offer support services in air quality monitoring and data collection, that align seamlessly with Alberta's Air Monitoring Directive (AMD). Calvin Consulting Group has a proven track record of developing Quality Assurance Plans (QAP) and executing monitoring audits.
Let us know if you need any extra information. Reach out to Barry at:
With our expertise, we guarantee the integrity of your monitoring systems, from SOPs to data retention rules. How to check data quality? Get in touch with us to evaluate your environmental data practices, increase the strength of your compliance, and move towards a more sustainable and data-driven future.
Alberta's AMD Chapter walks you through checking data quality.
Maintain continuous ambient data accuracy with amendments and documents specific to your project. Learn about data collection, scan rates, averaging intervals, wind direction standard deviation, and analog output verification. Here's your comprehensive guide to checking data quality with precision. 📊
Do you have concerns about air pollution in your area??
Perhaps modelling air pollution will provide the answers to your question.
That is what I do on a full-time basis. Find out if it is necessary for your project.
Have your Say...
on the StuffintheAir facebook page
Other topics listed in these guides:
The Stuff-in-the-Air Site Map
And,
Thank you to my research and writing assistants, ChatGPT and WordTune, as well as Wombo and others for the images.
OpenAI's large-scale language generation model (and others provided by Google and Meta), helped generate this text. As soon as draft language is generated, the author reviews, edits, and revises it to their own liking and is responsible for the content.


New! Comments
Do you like what you see here? Please let us know in the box below.