- Air Homepage
- Upper Atmosphere
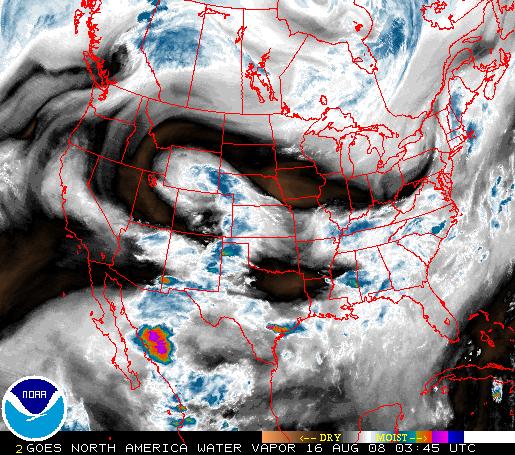
- Water Vapor Maps
Humidity, water vapor maps, and the tephigram
Search for more maps.
How does dampness affect the weather? Moisture and water vapor maps are equally important in determining these effects.
The Secret to Forecasting Dampness: Humidity Maps - Do you know that tracking the invisible mass of water vapor in the air helps predict everything from fog to violent nocturnal thunderstorms? Explore the advanced thermodynamic secrets of meteorologists, like how tools like the tephigram help them see what weather is being conserved and what's about to blow up.
Why are they important? Humidity affects weather and the environment, so science students study it. Plants and animals are affected by humidity, as well as climate and local weather patterns. Having a better understanding of humidity can help scientists predict and prepare for extreme weather events.
What is the best way to deal with humid air in meteorology? We'll start with a recap of the most important humidity variables:
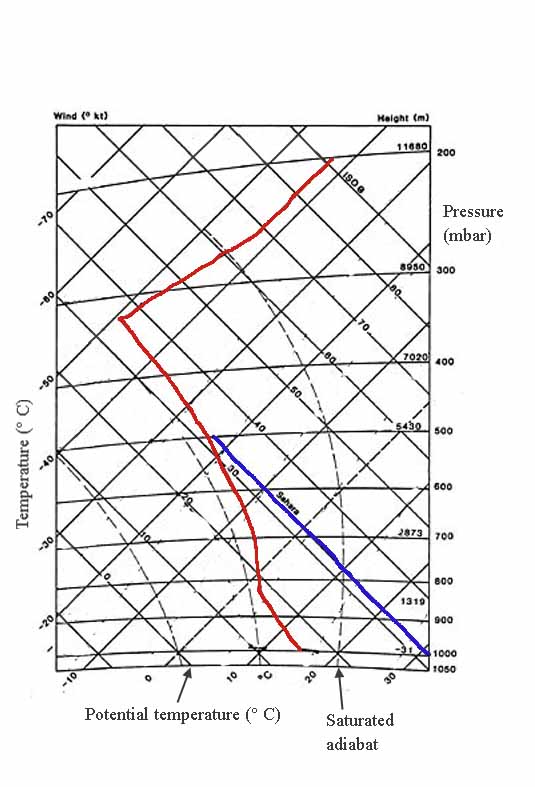
1) Mixing ratio (r) of water vapour to dry air, expressed in grams per kilogram. Lines with constant mixing ratios go straight up steeply to the right on the tephigram (a vertical water vapour map).
2) The Relative humidity (RH) is the ratio of the air's actual mixing ratio to its mixing ratio if saturated at the same temperature and pressure. Then multiply by 100 to get a percent. Both temperature and humidity recorders are needed for this one.
Most water vapor maps show relative humidity. Divide by the mixing ratio that passes through the intersection of the isobar's intersection with the dew point temperature and the actual temperature isotherm. A 100 percent RH means there's no difference between these two temperatures.
3) The Specific humidity (q) is the ratio of the mass of water vapor to the total mass, including water.
4) Absolute humidity - The density of the water vapour present in the air (in grams per cubic meter) is the absolute humidity.
Please refer to the list of thermodynamic temperature conversions used in tephigram analysis.
Meteorological Processes
Meteorology usually deals with humid air by understanding how humidity affects weather patterns and forecasting. Meteorologists deal with humid air in a few ways:
- Humidity measurements: Meteorologists use hygrometers to measure air moisture. Other important variables like dew point temperature and relative humidity are calculated with this info.
- Weather models use humidity data to predict how moisture in the air will affect weather. Meteorologists use these models to predict weather events like thunderstorms and tropical cyclones.
- Moisture levels in the atmosphere are monitored by meteorologists to spot thunderstorms or other types of precipitation. Weather advisories and warnings are based on this information.
- Satellites and radar systems can tell you where and how much moisture is in the air. Tropical storms and hurricanes are tracked using this data.
- Meteorologists often collaborate with other experts, like hydrologists and climatologists, to better understand how humidity affects weather patterns.
We can use thermodynamic charts to analyze the moisture profile and see how the variables change. If you're having trouble understanding, you might want to print the tephigram or skew T diagram and follow along with the descriptions below:
Various mechanisms cool air down after it gets heated by the sun or the ground below. It might move uphill, downhill, or out onto the open water. It could also mix with other air with different properties, get rain from above, or encounter one of many other changes. We can categorize and mark off these effects with water vapor maps. These responses are called meteorological processes, and we sort them by type:
Adiabatic process: - There's no heat given or received by the air in an adiabatic process. Only compression or expansion changes its temperature.
Diabatic process: - As opposed to adiabatic, diabatic happens when heat flows into or out of air through sunlight or moving over cooler ground.
Isobaric process: - Processes that don't change pressure (or elevation) are isobaric.
Pseudo-adiabatic process: - A pseudo-adiabatic process is when water evaporates into or condenses out of the air, like clouds. Even if the water leaves or enters, the latent heat stays behind.
As a result of these processes, a specified property of the air is conserved. It remains the same. It is possible that the temperature remains constant, but this is not always the case.
As air passes over high terrain and comes down warm and dry, Chinook (or other foehn) winds are created. There is no conservation of temperature, relative humidity, or dewpoint.
However, the wet bulb potential temperature (θw) remains constant, barring any external influences which may cause the air to change. It is possible to describe this process as pseudo-adiabatic; the dry adiabat line and the mixing ratio line will always intersect on the same pseudo-adiabat line. There is even a change in the (ordinary) potential temperature.
For these special cases, air near the ground, how do forecasters use the tephigram? If the elevation changes, the potential temperature remains the same, and you can move along an adiabat.
Due to surface heating or cooling, caused by incoming or outgoing radiation, our water vapor maps indicate that moisture remains constant regardless of heat and temperature changes. The dew point remains the same, but the relative humidity does not.
As air moves over water, there are abrupt boundaries on water vapor maps, moisture changes, temperature usually changes, and nothing is conserved. How does it work?
- Cold air over warm water - At lower levels, the air becomes warmer and more moist. As a result, it may become unstable (top-heavy) and stormy.
- The air cools and the humidity increases when dry warm air is placed over cool water.
- When moist warm air passes over cool water, the air cools and fog may form.
#30
Rain falling through the air
How does this result turn out?
The additional moisture likely raises the dewpoint and mixing ratio. Check out the maps for these changes. Evaporating that water transforms some of the air's heat energy, lowering the temperature. In this case, the web-bulb potential temperature doesn't change.
High Water Vapor Maps:
When cloud tops cool at night
The earth gives off infrared radiation all the time, thereby losing heat constantly. Most of the time, it comes from the highest object, including clouds. During the night, when there's no incoming solar energy, the cloud tops cool. Diabatic modification = heat loss. In some regions, the cloud turns over and causes nocturnal thunderstorms.
Clouds can also form at night if humidity prevents energy from escaping. The air cools at the top instead. When it's cool enough, clouds appear out of nowhere. To handle this, the forecasting meteorologist can study his water vapor maps more closely.
Go back from Water Vapor Maps to the
Chasing Storms webpage.
Search this site for more information now.
How water vapour data Help Improve YOUR Forecast?
Meteorologists use water vapor maps from radiosonde data to incorporate vital air moisture information into their forecasts.
Do you have concerns about air pollution in your area??
Perhaps modelling air pollution will provide the answers to your question.
That is what I do on a full-time basis. Find out if it is necessary for your project.
Have your Say...
on the StuffintheAir facebook page
Other topics listed in these guides:
The Stuff-in-the-Air Site Map
And,
Thank you to my research and writing assistants, ChatGPT and WordTune, as well as Wombo and others for the images.
OpenAI's large-scale language generation model (and others provided by Google and Meta), helped generate this text. As soon as draft language is generated, the author reviews, edits, and revises it to their own liking and is responsible for the content.


New! Comments
Do you like what you see here? Please let us know in the box below.