Air pollution statistics
by Kavin
(London, England)


Air data processing
Can you please provide me with information regarding air pollution statistics in G8 countries?
Ideally, I would appreciate if I could get hold of the emission levels of pollution during the last 50 years or so.Barry's Response - Kavin: This information will be scattered about the net. It's easiest to search by country and compile the data yourself. It will also be hard to go back that far in history, as most data gathering started circa 1990.
Here are two examples. For Canada:
http://www.ec.gc.ca/cas-aqhi/default.asp?lang=En&n=CB0ADB16%961
I would forward offline data if I had any. I have been using Google to search with with the terms
air (pollution or emission) (statistics or history) COUNTRY
If you perform a similar search for environmental impact assessment in your region, you could find that many of these reports contain the type of data you are looking for. In the meantime, I have a few thoughts about this below...
See what other air pollution statistics you get with these combinations.
Search this site for more information now.
We breathe through air pollution statistics, but they're really the diary of our lives.
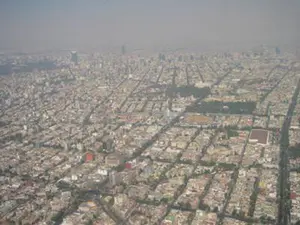
Since 1980, sulphur dioxide (SO2) emissions in the G8 countries have dropped by more than 80%. Smog and ozone are fuelled by nitrogen oxides (NOx). As a result of coal plant regulations, SO2 levels in Canada dropped from 4,500 kilotons in 1980 to under 300 by 2020.Particulate matter (PM₂.₅) - those tiny specks that get into your lungs - hasn't dropped as dramatically, partly because of wildfires, wood stoves, and diesel exhaust. The Canadian fire plumes pushed PM₂.₅ in New York City higher than Beijing's in 2023, if only for a day. Global graffiti became pollution.
What's the point?
It shows air pollution statistics aren't destiny. Fuels, cities, habits - they're choices. Some conservatives say: "We cleaned up acid rain without wrecking the economy — maybe we can do the same with today's challenges without panic." Others, especially on the left, argue that inequality means the poor still breathe the dirtiest air, so environmental justice demands stronger policies. It's important to hear both sides.You'll find echoes in theology too, where humanity is framed as stewards of creation, responsible for caring for the garden, not choking it. That's not climate alarmism; that's ethics.
Honesty.
Imagine if environmental statistics were told as comics, murals, or interactive maps. Imagine scrolling and watching emissions melt like ice cubes, or wildfire smoke curling out of your phone. Here's where science meets art.Here's the fun part: some contrarians might say, "Why worry?". “Volcanoes pump out more sulphur than humans!” Mount Pinatubo cooled the Earth more than decades of CO2 cuts would. But unlike volcanoes, our emissions don't go away overnight. That's why air pollution statistics matter.
Storytelling mixed with science invites freedom of thought
Laugh, question, argue - and maybe even design the next revolutions in monitoring such as AI or wearable pollution trackers, neighborhood sensors that gamify clean air, or blockchain-backed emission registries.Don't just swallow the numbers - play with them. What's missing? Is it overhyped? Why do smog maps look like tie-dye? Let me know what you think. You never know, right? Maybe you'll start the next environmental movement.
Comments for Air pollution statistics
|
||
|
||
|
||
Recent Articles
-
What causes pollution in the outside?
May 12, 26 12:44 AM
 The Hidden World of Pollution - Does the air you breathe have anything to do with a distant volcano or a dusty farm field? There's more to the gray haze
 -
UNDERWEAR AND POLLUTION
May 11, 26 12:12 AM
 Can Underwear Save the Earth? - What if your favorite pair of underwear were the only thing stopping a climate catastrophe? The hilarious truth about farts,
 -
Levi Mays Story about little boys
May 09, 26 07:06 PM
 The Secret History of Hot Air - Ever feel like there's more to what you see on the news? Get your detective gear on because we're diving into a world of
Do you have concerns about air pollution in your area??
Perhaps modelling air pollution will provide the answers to your question.
That is what I do on a full-time basis. Find out if it is necessary for your project.
Have your Say...
on the StuffintheAir facebook page
Other topics listed in these guides:
The Stuff-in-the-Air Site Map
And,
Thank you to my research and writing assistants, ChatGPT and WordTune, as well as Wombo and others for the images.
OpenAI's large-scale language generation model (and others provided by Google and Meta), helped generate this text. As soon as draft language is generated, the author reviews, edits, and revises it to their own liking and is responsible for the content.
Most Popular Pages on this Website:
Pictures of Global Warming
- See photos, cartoons, charts, graphs and a few surprises.
Clouds
- Don't know a cumulus from a stratus? Check here.
Causes of Global Warming
- It's not always obvious.
Calgary Alberta Weather
- Example of Canadian Goodness.
Thermometers
- Our favourite weather instrument.
- Home
- Contact Us
- Free E-zine Back Issues
- Privacy Policy
- Site Map - I'll help find something good.
By Barry Lough, P.Met., EP (Environmental Professional)
Text copyright © 2003-2024 Stuff in the Air.com
BACK TO TOP - Hit your 'Home' Key