The Science of Meteorology Online
climate change
by anya
(uae)


Smile.
I am a student of 5th grade and on Thursday, my teacher told me to draw a picture of climate change.
I don't know how to do it.can you help me pleeeeeeeeeeeeeeeeeeeeeeeeeeease???????Barry's Response - Make a funny cartoon about it if you can. You can draw a graph or a map if you have some good data. Draw our earth (or a globe) if you care about it. Here's an example to
Get you started.
You could pick a glacier, a flood, an iceberg, a desert. Climate change causes all of these things.
Most of the graphics and pictures I find on Google are maps and graphs. It's a science subject, so this approach seems right.
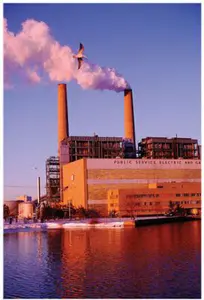
By default, this one - https://www.globalwarmingart.com/wiki/Special:SeaLevel - shows the impact of a sea level rise on coastal communities in the USA, but you could make one for any country or coastline.
Look at the graphs on the Wikipedia page about global warming. https://en.wikipedia.org/wiki/Global_warming - We see past and/or projected data displayed in a graphical manner to illustrate situations and trends for quick understanding. It's a great way to present quantitative data.
You could make a drawing from a photo that represents the situation pretty well if you're more into art than math. Choose something that represents it to you.
You could do a comic drawing of someone famous associated with global warming for comic effect. Al Gore is a most obvious example.
If you let it, this could be a lot of fun.
Search this site for more information now.
P.S. Keep it light - e.g., I love the environment, but it doesn't love me back!
Example 2 - Picture of Climate Change
Imagine a colorful picture that tells a story about our planet and the changes it's going through. The picture shows a big, vibrant Earth with a beautiful blue ocean and lush green forests. We're surrounded by happy animals, like playful dolphins, soaring eagles, and cute polar bears.
You'll notice something if you look closely. As you move towards the edges, the colors start to change. Forests are gone, and the ocean is darker, showing signs of pollution. Animals like polar bears are struggling to find enough ice to rest on, while turtles are getting tangled in plastic.
Despite all these changes, there are signs of hope. A group of kids is planting trees, symbolizing their efforts to restore the forests. The transition to clean and renewable energy is evident with wind turbines and solar panels. We're working together to protect marine life and clean up the ocean.
Most importantly, the picture conveys a message of unity and resilience. We're encouraged to be mindful of our actions, reduce our carbon footprint, and take care of our planet. The picture inspires hope and empowers kids to make a difference by showing the beauty of nature.
Remember, we can create a world where nature thrives and all living beings, including ourselves, live in harmony. Let's cherish this picture, learn from it, and work together to protect our planet.
Recent Articles
-
the sun
May 17, 26 07:26 PM
 Cosmic Midlife Crisis: - Is the Sun Melting the Earth? Are you worried that the giant burning star in our sky is melting the Earth? Global warming isn't
 -
methane air pollution
May 16, 26 02:20 AM
 Methane is the secret smog maker - Gas from farm animals and garbage dumps can turn a blue sky into a brown soup? It turns out methane gas is linked to
 -
Global Warming Klan
May 15, 26 12:57 AM
 Planet Rescue: Real Action or Total Chaos? - Some people are so worried about the world that they come up with some pretty crazy ideas. Discover how kids

Do you have concerns about air pollution in your area??
Perhaps modelling air pollution will provide the answers to your question.
That is what I do on a full-time basis. Find out if it is necessary for your project.
Have your Say...
on the StuffintheAir facebook page
Other topics listed in these guides:
The Stuff-in-the-Air Site Map
And,
Thank you to my research and writing assistants, and the author remains responsible for the content.
Most Popular Pages on this Website:
Pictures of Global Warming
- See photos, cartoons, charts, graphs and a few surprises.
Clouds
- Don't know a cumulus from a stratus? Check here.
Causes of Global Warming
- It's not always obvious.
Calgary Alberta Weather
- Example of Canadian Goodness.
Thermometers
- Our favourite weather instrument.
- Home
- Contact Us
- Free E-zine Back Issues
- Privacy Policy
- Site Map - I'll help find something good.
By Barry Lough, P.Met., EP (Environmental Professional)
Text copyright © 2003-2024 Stuff in the Air.com
BACK TO TOP - Hit your 'Home' Key