- Air Homepage
- About Us
- Physics Formula
An example of a physics formula - How physical is meteorology?
How does a physics formula handle weather data complications? It's possible to calculate the effects of meteorological changes in a job processing weather data using physics formulas. Understanding how different weather conditions affect the job can help organize and manage it better. It can improve efficiency and reduce errors.
Search for more atmospheric science.
Using physics to master air pressure and altitude How do meteorologists compare the weather in a mountain city like Spokane to a sea-level port like Seattle? Create a level playing field for forecasters by unlocking the powerful, yet simple, physics formula that takes away the confusion of altitude!
You might find this article interesting if you want to understand how physics formulas can be used to handle complications in weather data. Find insights into the natural world and how these sciences are applied to the environment.

Physics formulas can also predict future weather conditions, so you can plan and prepare better. The data can be used to adjust the job process to maximize efficiency and minimize risk. This simple example relates elevation changes to air pressure.
You can use it for air pressure science experiments and it converts between metric and imperial units. It's great
for air pressure experiments and has metric and imperial unit conversions.
The Value of Learning Physics and Meteorology
What's the point of learning about physics and meteorology?
- Understanding the natural world: Physics studies the laws and principles that govern the universe, and meteorology studies the atmosphere and its phenomena. These sciences can help you understand how the natural world works and how different processes interact.
- Physics and meteorology have many practical applications in our everyday lives, like predicting weather patterns, helping engineers and other professionals design buildings and bridges, and developing new technologies. Understanding these fields can help you appreciate the role they play in society and how they can improve our lives.
- There are a lot of career options in physics, chemistry, meteorology and other STEM fields, from research and academia to industry and government. Getting an understanding of these fields can help you explore potential career paths and learn the skills and knowledge needed to succeed.
- For some people, learning about physics and meteorology is just out of curiosity and personal interest. It can be a rewarding and intellectually stimulating experience
A comprehensive pressure conversion physics formula, such as the thermodynamic Clausius Clapyron, equation incorporates:
1 - Recent barometric pressure,
2 - temperature, and
3 - humidity changes
...into the formula. The equation expresses the relationship between entropy change and enthalpy change. The change in entropy is proportional to the change in enthalpy divided by the temperature.
A basic algorithm for use in atmosphere levels

Here's the simplest atmospheric physics formula:
Your Pressure = Sea Level Pressure / 2 ^ (Z/Zo)
...where Z is your altitude and Zo is about 18,400 feet. It provides a reasonable estimate.
For each surface measurement, meteorologists need corresponding sea level pressures. Say Seattle has a barometric pressure of 1000 millibars today, but Spokane has only 930.
Most of that pressure change would be caused by the difference in elevation, 2400 feet. A millibar is a metric unit of pressure commonly used in weather forecasting.
Using a standard atmospheric pressure chart and some interpolation, you'd expect a pressure around 929 mb. That's a sea-level pressure of 1000.
Now we can compare them. By adjusting pressures to equivalent sea level values, all locations are placed on a "uniform field" and pressure differences can be traced back to weather systems. By removing the effects of altitude, you can compare locations better. Also, it makes weather forecasting more accurate since pressure differences can be observed and understood more easily.
This algorithm calculates how much pressure would be felt at each location if the ground were lowered to sea level. It's called hydrostatic pressure. Structures built on a particular terrain are more stable because of it. Engineers can design buildings that can withstand hydrostatic pressure by knowing it.
The conversion would give Spokane a corrected pressure of around 1000 millibars. Temperature and humidity would be taken into account in the detailed physics formula. Temperature and humidity can affect pressure readings. This formula takes these two factors into account to get a more accurate pressure reading than raw data.
Meteorologists calculate a quantity known as potential temperature. Basically, they figure out what temperature any parcel of air would have if it was adiabatically pressurized to exactly 1000 mb.
The temperature of the "environment" or "ambient" air can be compared to the temperature of the parcel of air you are tracking. When air parcels rise or fall in the atmosphere, potential temperature represents their final temperature when reaching near sea level. Adiabatic means without any air or heat leaking in or out.
By using this pseudo-value (which is what potential temperature really is), they can simplify their calculations. Moisture complicates things, so we use Wet-Bulb Potential Temperature, Θw instead.
Physics formula on changes in the pressure
As weather systems move and progress, they change the pressure.
Maps show isallobars, lines of equal pressure change. Isobars look like these curves. This chart shows synoptic patterns which tell us more about the current systems.

Is the atmosphere really a big sea with tides like the ocean? It's made of air instead of water.
Weather scientists need to separate pressure changes caused by rhythmic tides, especially on a twelve-hour cycle, from those caused by weather anomalies moving. In the process of moving, weather systems also change.
In their formula, they subtract a time-dependent amount from the actual readings. An interesting physics science fair project would be one that illustrates this principle.
You can gain valuable insights into the natural world and its workings by reading about physics and meteorology. Want to know more? Explore the Weather Ezine back catalogue - science explained.
Check out more pages on the website for more science explanations and insights into weather. Go back from Physics Formula to the Weather Man web page.
Search this site for more information now.
Recent Articles
-
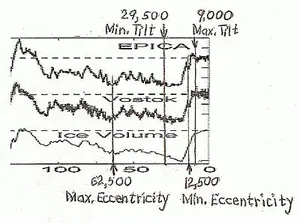
The Combination of Earth's Tilt and Eccentricity Cause Both Warming and Cooling
Apr 19, 26 09:27 PM
 The Great Cosmic Seesaw - You know how Earth wobbles around the Sun, deciding when it freezes over and heats up? We're about to find out how these giant
 -
How much pollution does a plane put out
Apr 18, 26 02:51 PM
 The Mission to Measure Flight - Do you ever wonder if those white streaks behind a jet are just harmless clouds or pollution? Let's dig into the math of
 -
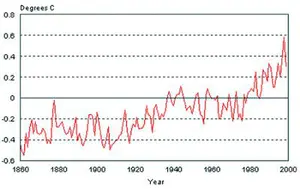
global warming increase temperature
Apr 18, 26 02:26 PM
 We're in a climate tug-of-war - You're standing in front of a giant control panel with a thousand dials that control the weather, oceans, and air. Right

Do you know how physics applies to air?
The application of a physics formula to meteorology. Altitude conversions, air pressure, and weather systems.
Do you have concerns about air pollution in your area??
Perhaps modelling air pollution will provide the answers to your question.
That is what I do on a full-time basis. Find out if it is necessary for your project.
Have your Say...
on the StuffintheAir facebook page
Other topics listed in these guides:
The Stuff-in-the-Air Site Map
And,
Thank you to my research and writing assistants, ChatGPT and WordTune, as well as Wombo and others for the images.
OpenAI's large-scale language generation model (and others provided by Google and Meta), helped generate this text. As soon as draft language is generated, the author reviews, edits, and revises it to their own liking and is responsible for the content.
By Barry Lough, P.Met., EP (Environmental Professional)
Text copyright © 2003-2024 Stuff in the Air.com
BACK TO TOP - Hit your 'Home' Key
New! Comments
Do you like what you see here? Please let us know in the box below.