- Air Homepage
- Weather Satellites
- Map Photo Satellite
Cutting-edge: Using map photo satellite technology and advanced algorithms to forecast the future
As a meteorologist, I provide weather forecasts. Map photo satellite and radar images are some of my graphical tools. I hope you like them too...
Find out how cutting-edge satellites and complex algorithms build a hidden, three-dimensional profile of our atmosphere. Find out how raw orbital data becomes the precise vertical temperature and humidity measurements you need for tomorrow's forecast! How We Build a Vertical Map of the Atmosphere From Satellite Soundings
Search for more weather technology.
While I provide information about meteorology and satellite technology, it shouldn't be too complicated for you. For readers who are curious about weather, I like simplifying the content and language. Using relatable examples, incorporating more visuals, and focusing on the basics of weather forecasting could make this article more appealing.
What can we do to determine patterns? Check out this basket of tricks we use. Fill in the blanks.
First, we make vertical outlines of key variables using facts from various sources. Computer programs chart dew point, temperature, and other stuff for us.
Then you'd have to make a 3D representation of each number. Forecasting models and vertical mapping software use this product. Data is handled by these computer programs. Satellite photos from:

Advanced uses for satellite data
Fitting into the big picture - From a launch station, a radiosonde, follows a weather balloon up through the atmosphere. Radiosondes measure temperature, humidity, wind etc. Using radio waves, they send the information back to the station.

We can analyze map photo satellite images and drawings after we put the data on the map. This helps us figure out where things are going geographically. Data can also help us make better decisions and it can be used to track environmental changes. You can then compare the radiosonde data with satellite images.
There's a lot of value here, but it's still limited. We only send this expensive little equipment package twice a day from each dispatch station. Satellites would be a lot more efficient if they replaced this old technology. Satellite information can at least enhance vertical profiles derived by other means. Especially over oceans and remote places.
Map photo satellites are more sophisticated, and techniques will keep improving.
How to make the map photo satellite profiles?
Filters change the look of scanned images. We add supplementary data, then run it through more computers.
Weather satellites use many wavelengths to dance around atmospheric gas absorption spectra. Carbon dioxide, oxygen, water vapour, and ozone have different bands.
Light spectrum wavelengths can help sort out small differences in intensities. Comparing our traces with known compositions helps us identify substances.
Atmosphere layers stop radiation from below and re-emit it. It affects what the map photo satellite sees. Satellites get radiation from emitting layers. What can we do to fill in the gaps?
In other wavelengths, the layer's weaker absorption allows some radiation from the surface and lower atmosphere to get through. Research went into devising weighting functions and simpler algorithms to separate meaning from chaos.
Physical Science Tests
The atmosphere is evenly distributed with oxygen and carbon dioxide. Satellite temperature soundings are useful because of this scattering. Humidity and ozone profiles are calculated using the data and other physical properties.

Clouds complicate things even more. Although they're distorted by rain, microwaves from the earth give us more information. Microwaves are stopped by precipitation. Radar is useful because of that.
We can build temperature and humidity profiles in cloudy areas this way. It's best to use these numbers to fortify infrared data. How complete is it?
For this to work, we need good vertical resolution, less than a kilometer. Inversion temperature anomalies, which increase temperature with height, cause ambiguity in photos. With this data, we can come up with more than one solution.
Here's what you need...statistics! Researchers build profiles by trial and error. To fill in the gaps, they construct empirical correlations between measured and expected values.
How? Linear regression statistics and other formulas are used to derive mathematical variables. By adjusting a standardized profile, computers work out deviation vectors and make a more realistic profile.

#24
Search this site for more information now.
Meteorology and Statistics
As with any guesswork, accuracy is a challenge, especially when good map photo satellite data is scarce. First guesses are sometimes taken too seriously without being all that good. What can we do about it?
This gets better with intensive explorations and longitudinal studies. As pattern recognition software develops and data libraries grow, non-linear physics problems will get solved and even initial estimates will be better.
The huge math is easier to handle with more powerful computers. We can now do iterative calculations quickly and get more information from less data by repeating them many times. They'll be able to do their jobs even better with newer map photo satellite equipment. Likewise, more research into theory will make it easier to interpret the pictures.
Can you do it better?
You like this Idea? It works for its intended purpose, but probably is not perfect. Why not?
Do you know of a better one? We'd all like to see it, I'll bet. A penny for your thoughts.
Other people and their ideas...
Click below to see hi-tech contributions from other visitors to this page...
storms photos Not rated yet
I have a great photo I took of lightning near Fort McMurray Alberta. I would really like to share it with others...is there any one I can send it to?? …
If you found this interesting, you could try your local library for further information. Look under Dewey call numbers 621 and 551.
Navigate back from Map Photo Satellite to the Image Satellite Weather webpage, or go the Stuff in the Air homepage.
Recent Articles
-
the sun
May 17, 26 07:26 PM
 Cosmic Midlife Crisis: - Is the Sun Melting the Earth? Are you worried that the giant burning star in our sky is melting the Earth? Global warming isn't
 -
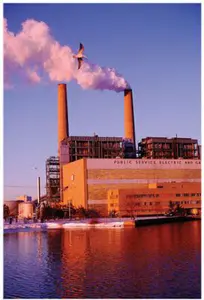
methane air pollution
May 16, 26 02:20 AM
 Methane is the secret smog maker - Gas from farm animals and garbage dumps can turn a blue sky into a brown soup? It turns out methane gas is linked to
 -
Global Warming Klan
May 15, 26 12:57 AM
 Planet Rescue: Real Action or Total Chaos? - Some people are so worried about the world that they come up with some pretty crazy ideas. Discover how kids

Map Photo Satellite - What is the role of satellites in monitoring?
To create a three-dimensional weather map photo satellite data becomes reconfigured to give us atmospheric profiles.
Do you have concerns about air pollution in your area??
Perhaps modelling air pollution will provide the answers to your question.
That is what I do on a full-time basis. Find out if it is necessary for your project.
Have your Say...
on the StuffintheAir facebook page
Other topics listed in these guides:
The Stuff-in-the-Air Site Map
And,
Thank you to my research and writing assistants, and the author remains responsible for the content.
By Barry Lough, P.Met., EP (Environmental Professional)
Text copyright © 2003-2024 Stuff in the Air.com
BACK TO TOP - Hit your 'Home' Key