- Air Homepage
- Weather Maps
- Upper Air Maps
Waves on the world map latitude longitude and weather
See this world map latitude longitude lines, oceans, continents and poles? The horizontal lines at the top and bottom are half as long as the equator line in the Eckert IV projection.
Right click and then view image to see a bigger version. In this example, the latitude lines (going straight across) are 15 degrees apart, and the longitude lines (up-and-down, forming curves) are 30 degrees apart. Right and left edges of the map are the prime meridian.

Decoding weather patterns on the world map with the Global Wave Theory - Did you know your forecast is often determined by colossal, slow-moving waves spanning continents thousands of feet above you? Learn how to spot these massive Rossby waves—and their faster-moving short wave cousins—that determine whether your day will bring clear skies or a powerful, soaking rain!
Navigation, geography, and cartography rely on world map latitude longitude and similar features. Each field uses them differently:
- The latitude and longitude provide precise coordinates for any location on Earth, which are crucial for navigation on land, sea, and air. To chart a course to their destination, navigators use these coordinates. Another common usage in navigation is that latitude and longitude are used in modern GPS devices to provide real-time location data
- Latitude and longitude are used by geographers to create detailed maps. Geographic features can be found and identified using these coordinates. For example, climate patterns are strongly influenced by latitude. Those near the equator receive more direct sunlight, resulting in warmer climates, while those near the poles are colder
- Cartographers use latitude and longitude to draw maps with precise cities, landmarks, and natural features. Maps can be created accurately and are scalable with this system. This way latitude and longitude grids help users find specific locations and understand spatial relationships between areas by displaying latitude and longitude lines.
What do we do with a map this big? Waves on a meteorological map look a little chaotic. How do these waves work?
Several books have been written about wave theory, both in meteorology and other branches of physics. Wave patterns appear on upper-level atmospheric maps, and seeing the big picture improves clarity if they can be shown in a single image.
You can see a weather map with large waves above, then use your back button to come back here and continue reading. First, we'll look at the broad waves - huge up and down patterns spanning half the globe and reaching 30 latitudes or more. It's zero to 90 degrees north and south for latitudes, and zero to 180 degrees east and west for longitudes.
We're on the ground; why do we care about what's up there?
Upper air waves, also known as atmospheric waves, can have a big impact on weather patterns. Temperature differences between air masses can cause these waves, which can create ridges and troughs in atmospheric pressure patterns.

Meteorologists use weather balloons and satellites to track temperature, pressure, and wind patterns in the upper atmosphere to forecast the weather. Using this data, a three-dimensional model of the atmosphere is created to identify any patterns or waves that might affect the weather.
Also, forecasters use computer models to predict how waves will move over time and how the upper atmosphere will behave. Weather models take temperature, humidity, wind speed, and direction into account, and can help forecasters predict the movement of weather systems.
Meteorologists use upper air waves to forecast weather, but they also consider surface temperatures, moisture levels, and other weather systems, like fronts and low pressure systems. We can provide better weather forecasts when they take all these factors into account.
World Map Latitude Longitude and Rossby Waves
There's a variable called Wave number that tells you how many huge main waves there are on each hemisphere. Usually three or four, but it can vary from two to five.

There are Rossby waves in the atmosphere that are caused by large features like oceans and mountains, which shield higher temperatures from colder air masses. This is where we see our large-scale ridges and troughs, , called Rossby Air Waves...like the ones in this simplified jet-stream example on the right.
To get a better idea of where these waves are, you might need animated maps from several sequential time frames. In their world map latitude longitude ranges, long waves don't move very fast, and they usually travel left to right.
What is a short wave?
No more than about half as long as a long wave.
Short waves move faster, though. The bumps travel eastward up and down the long wave. These waves correspond roughly with synoptic systems and are where meteorologists label most of our upper troughs and ridges.
These ones are also correlated with maximum and minimum vorticity values, with troughs associated with higher vorticity and ridges with lower vorticity. An axis of maximum vorticity is indicated by a short-wave trough.
So what? Weather is explained this way: air rises and clouds form ahead of a trough, while air descends and clouds dissipate in front of a ridge. Troughs and ridges play an important role in determining weather patterns and can have significant impacts on local and regional weather. Here's how it works:
 Mountain ranges, weather, and valleys
Weather is impacted by ridges and troughs in the atmospheric pressure pattern. A trough has low atmospheric pressure, while a ridge has high atmospheric pressure. The movement of air and the formation of weather systems can be affected by these pressure features.
Cold fronts, low-pressure systems, and storms can be caused by troughs. In a trough, air rises and cools, forming clouds and precipitation. Rainy or stormy weather can result.
Ridges, on the other hand, are associated with warm, dry weather. When air flows into a ridge, it warms and suppresses cloud formation, so it's clear skies and warm.
Weather systems can also move and intensify because of troughs and ridges. A trough, for example, can make a weather system move more slowly or stall, while a ridge can speed it up.
Vorticity and cloud generation are related to vertical motion. When the air near the Earth's surface rises, clouds form. This happens because rising air cools as it ascends, and the cooling causes the air to condense and form clouds. It's the rotation in the atmosphere caused by vertical motion, because the vertical motions of the air can cause the air to rotate.
By comparing map imagery with satellite photos, analysts and forecasters can find world map latitude longitude - troughs and ridges. Over the oceans, for example, there isn't a lot of surface-based data to use.
Recent Articles
-
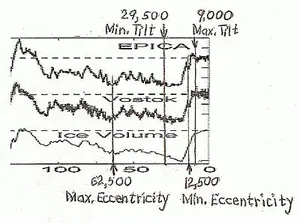
The Combination of Earth's Tilt and Eccentricity Cause Both Warming and Cooling
Apr 19, 26 09:27 PM
 The Great Cosmic Seesaw - You know how Earth wobbles around the Sun, deciding when it freezes over and heats up? We're about to find out how these giant
 -
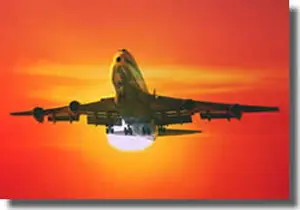
How much pollution does a plane put out
Apr 18, 26 02:51 PM
 The Mission to Measure Flight - Do you ever wonder if those white streaks behind a jet are just harmless clouds or pollution? Let's dig into the math of
 -
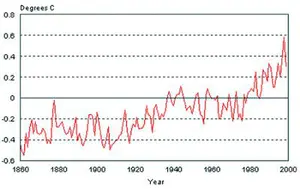
global warming increase temperature
Apr 18, 26 02:26 PM
 We're in a climate tug-of-war - You're standing in front of a giant control panel with a thousand dials that control the weather, oceans, and air. Right
What does the World Map Latitude Longitude mean for YOUR climate?
There are certain limits on the latitude longitude and amplitude of waves in the upper atmosphere as depicted on the world map.
Do you have concerns about air pollution in your area??
Perhaps modelling air pollution will provide the answers to your question.
That is what I do on a full-time basis. Find out if it is necessary for your project.
Have your Say...
on the StuffintheAir facebook page
Other topics listed in these guides:
The Stuff-in-the-Air Site Map
And,
Thank you to my research and writing assistants, ChatGPT and WordTune, as well as Wombo and others for the images.
OpenAI's large-scale language generation model (and others provided by Google and Meta), helped generate this text. As soon as draft language is generated, the author reviews, edits, and revises it to their own liking and is responsible for the content.
Most Popular Pages on this Website:
Pictures of Global Warming
- See photos, cartoons, charts, graphs and a few surprises.
Clouds
- Don't know a cumulus from a stratus? Check here.
Causes of Global Warming
- It's not always obvious.
Calgary Alberta Weather
- Example of Canadian Goodness.
Thermometers
- Our favourite weather instrument.
- Home
- Contact Us
- Free E-zine Back Issues
- Privacy Policy
- Site Map - I'll help find something good.
By Barry Lough, P.Met., EP (Environmental Professional)
Text copyright © 2003-2024 Stuff in the Air.com
BACK TO TOP - Hit your 'Home' Key
New! Comments
Do you like what you see here? Please let us know in the box below.