- Air Homepage
- Air Quality Modelling Service
- Air Quality Testing
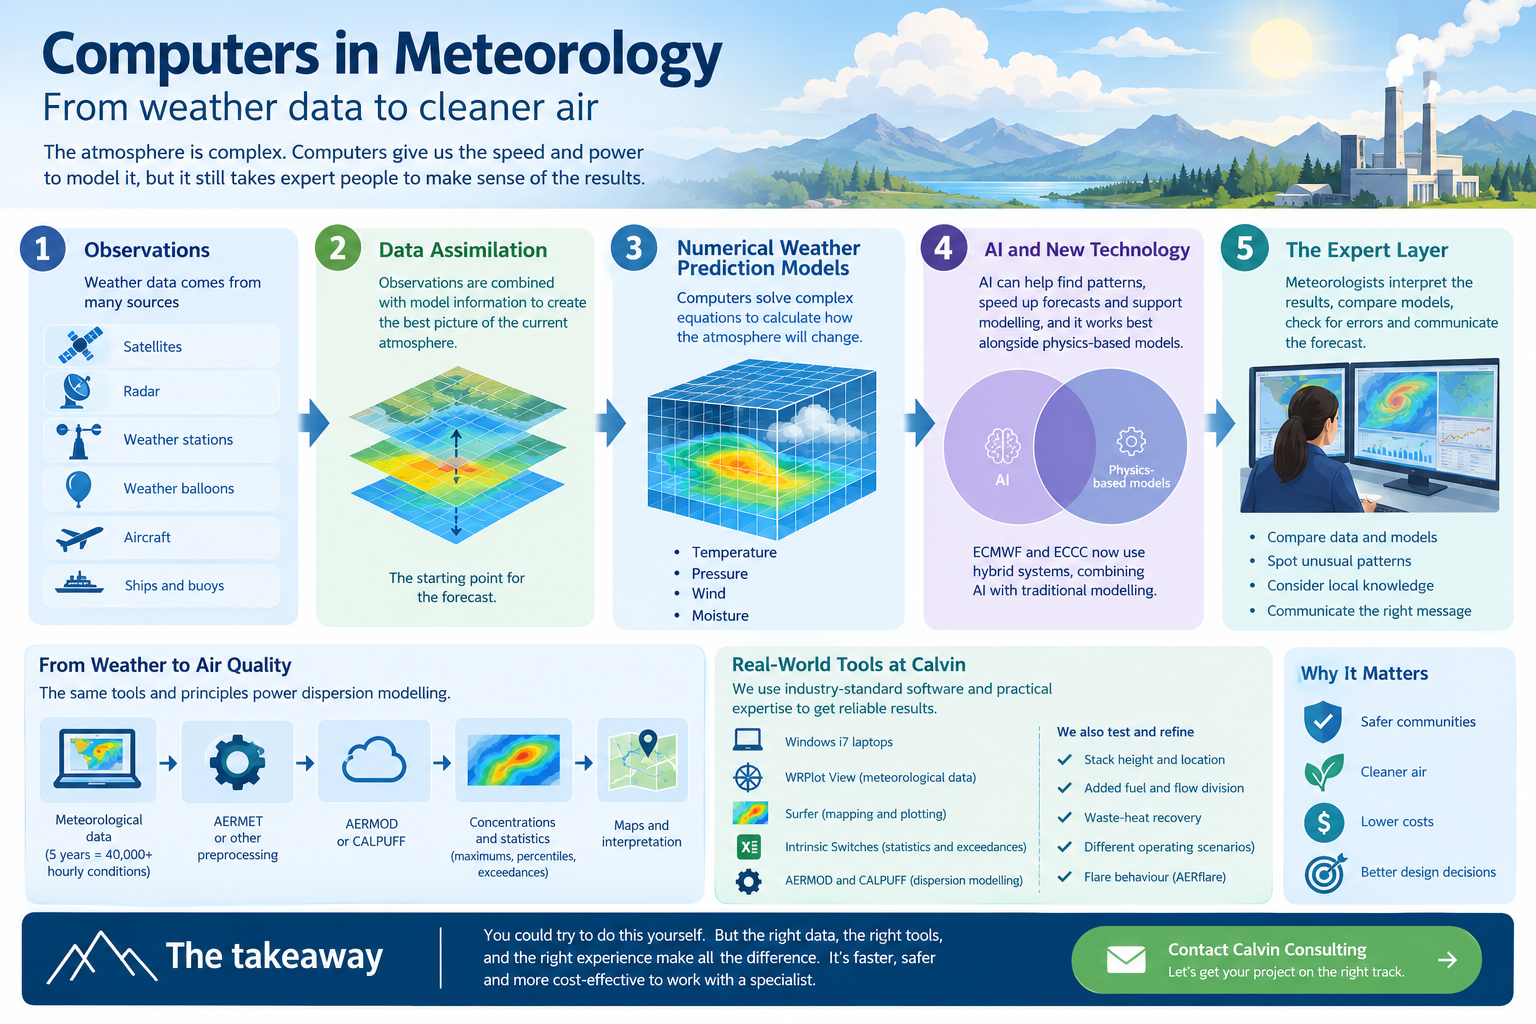
- Computers in Meteorology
Computers in Meteorology: How Machines Learned to Calculate the Weather
Could you forecast tomorrow's weather with a pencil and paper (without computers in meteorology)?
You could try. You would need observations from across the atmosphere, a huge collection of mathematical equations and an extraordinary amount of time.
Then you would have to do the calculation again...
And again....And again. That is why computers are so important in meteorology.
Modern weather forecasting is essentially a gigantic mathematical exercise involving the atmosphere's temperature, pressure, wind, moisture and other properties across three dimensions and through time.
The computer does the arithmetic fast enough to make the exercise useful. The meteorologist still has to understand what the arithmetic means. That distinction is the real story.
The one-minute answer
Modern weather forecasting follows a basic chain:
Observe the atmosphere → build the best picture of its current state → calculate how it will change → check the results → communicate the forecast
Computers are extraordinarily good at the calculation. They can process enormous quantities of observations and perform millions or billions of mathematical operations far faster than people can.
A numerical weather prediction model divides the atmosphere into a three-dimensional grid. Each part of the grid contains information such as:
- temperature
- pressure
- wind
- moisture
The model then applies mathematical representations of atmospheric physics to calculate what happens next. The computer advances the atmosphere through time in thousands of small steps.
Eventually, the model has produced a forecast. That is the basic idea behind modern computers in meteorology.
Find more about weather and technology.

What does a weather model actually do?
Imagine putting the atmosphere inside a giant three-dimensional spreadsheet. Every box contains numbers describing the atmosphere.
One box might represent the air over Calgary. Another might represent the atmosphere 100 metres above it. Another might be hundreds of kilometres away. The model has millions of such locations.
Now add time.
The computer needs to calculate how heat, pressure, moisture and momentum change from one time step to the next. That's where the numbers become formidable.

Atmospheric physics includes equations describing the movement of air, conservation of energy, moisture processes and other processes affecting the atmosphere. And some processes are smaller than the model's grid and cannot be represented directly. Clouds and turbulence are good examples.
The model therefore contains approximations and parameterizations for processes that occur below its explicit resolution. This is one reason a weather forecast is a scientific calculation rather than a crystal ball.
Before you can forecast the future, you need to know the present
This is one of the most important concepts in numerical weather prediction. A model cannot simply start with yesterday's forecast and assume it represents the atmosphere perfectly.
It needs the best possible description of the atmosphere right now. That's where observations and data assimilation come in.
Weather services collect observations from sources such as:
- surface weather stations
- weather balloons
- aircraft
- satellites
- radar
- ships
- buoys
- other observing systems including pilots
These measurements do not form a perfectly complete picture. There are gaps.
Measurements have uncertainty. Some observations are more useful for certain parts of the atmosphere than others.
Data assimilation combines observations with information from a previous model forecast to produce an improved estimate of the current state of the atmosphere. That estimate becomes the starting point for a new forecast.
A simple way to remember it is:
- Observations tell the model what the atmosphere is doing.
- Data assimilation helps build the best possible starting picture.
- The forecast model calculates what happens next.
This is one of the foundational ideas behind computers in meteorology.
So why can't we predict the weather perfectly?
Because the atmosphere is complicated. Three problems are particularly important.
We can't observe everything - Even an enormous observing network gives us only a sample of the real atmosphere. We cannot measure temperature, wind and moisture at every location and every altitude.
The equations are approximations - Atmospheric physics can be described mathematically, but a computer model cannot explicitly represent every swirl of turbulence or every tiny cloud droplet. Some processes have to be approximated.
The atmosphere is chaotic - Tiny differences in the starting atmospheric state can eventually produce larger differences in the forecast. That means uncertainty naturally increases with forecast lead time.
And this is why modern weather forecasting increasingly uses ensembles. Instead of producing one possible future, an ensemble runs multiple slightly different forecasts. The spread among them provides information about uncertainty.
So when your weather app says there is a 60% chance of rain, that probability isn't simply the forecaster hedging. It can be the result of an ensemble of possible atmospheric futures.
Could a million monkeys with a million calculators do it?
This is the wrong kind of monkey business. Suppose you gave a million people calculators. They could perform enormous numbers of calculations. They would still need to know:
- which equations to use
- what values to put into them
- where those values belong
- how atmospheric processes interact
- how to handle missing observations
- how to interpret the results
The hard part isn't simply arithmetic. It's organizing the arithmetic around a physical description of the atmosphere.
A million monkeys with a million calculators might produce a remarkable quantity of numbers. But they would still need a meteorological model.
What does the meteorologist do?
Computers are excellent calculators. Meteorologists are responsible for much more than calculation.
A meteorologist can compare:
- several forecast models
- radar observations
- satellite imagery
- surface observations
- atmospheric soundings
- climatology
- local terrain
- previous weather patterns
They can recognize when a model appears to be struggling. They can spot a developing storm that deserves special attention. They can interpret uncertainty.
They can decide how forecast information should be communicated to the public, emergency managers, pilots, farmers or other users.
That's why the most useful question isn't: Will computers replace meteorologists? A better question is: How can meteorologists use computers to do things that would otherwise be impossible?
Computers and humans have different strengths
Computers
Meteorologists
Perform enormous calculations
Interpret the atmosphere
Process huge datasets
Decide which information matters
Repeat calculations consistently
Recognize unusual situations
Run many scenarios
Evaluate competing explanations
Generate maps and graphs
Explain what the maps mean
Produce ensembles
Interpret uncertainty
Process observations rapidly
Apply local knowledge and experience
The most powerful forecasting system combines those strengths.
The computer does the calculation. The meteorologist decides what the calculation means. That sentence is worth remembering.
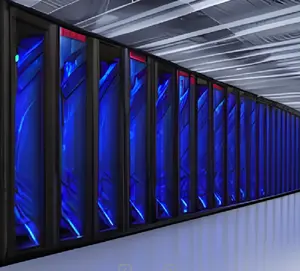
What happened to the giant supercomputer?
Early numerical weather prediction required some very impressive machines. Weather centres moved through generations of increasingly powerful mainframes and supercomputers as numerical models became more sophisticated.
Computing capacity increased enormously. Model resolution improved. More atmospheric variables could be represented. More observations could be assimilated. Ensemble forecasting became practical...
The history is fascinating, but the important lesson is simpler: As computers became more powerful, meteorologists could represent more of the atmosphere and calculate it faster.
Today the computing landscape is changing again. High-performance computing, cloud infrastructure, graphics processors and artificial intelligence are becoming part of the forecasting ecosystem.
The computer isn't disappearing. The computer is changing.
AI has entered weather forecasting
Artificial intelligence is no longer just a research experiment in meteorology.
ECMWF put its Artificial Intelligence Forecasting System, AIFS, into operational use in 2025 then introduced its ensemble AIFS system. AIFS now operates alongside the physics-based Integrated Forecasting System and is continually maintained.
Canada has followed a related path. Environment and Climate Change Canada launched an operational hybrid AI weather system that combines machine learning with traditional physics-based forecasting. Its Canadian system is designed to exploit AI's strengths while retaining the ability of physics-based modelling to represent important local atmospheric processes.
This is an important distinction. AI forecasting doesn't mean throwing away atmospheric physics.
One promising approach is to combine: observations + physics-based models + AI + human interpretation
AI can learn patterns from enormous archives of historical weather data. Physics-based models can explicitly represent atmospheric processes.
Together they can provide complementary information.
What is AI particularly good at?
Machine learning can be very fast once a trained system is running. That creates interesting possibilities.
AI can potentially:
- identify patterns in huge datasets
- accelerate forecast generation
- provide additional forecast scenarios
- identify relationships that are difficult to capture using conventional methods
- help interpret enormous observational datasets
- provide rapid predictions between expensive physics-based model runs
ECMWF reports that its operational AI systems can produce forecasts far more efficiently than conventional physics-based modelling for many applications. At present, however, its physics-based IFS remains essentialor higher-resolution fields and coupled Earth-system processes.
That last qualification matters. Fast does not automatically mean complete. A useful weather forecast depends on what information the user needs and at what scale.
Could AI change air-quality modelling too?
Probably. The same idea has obvious possibilities in atmospheric dispersion modelling.
Imagine an industrial assessment where a modeller wants to examine thousands of combinations of:
- stack height
- emission rate
- wind condition
- source location
- building configuration
- terrain
- operating scenario
Running a full dispersion model for every imaginable combination could become expensive.
A carefully developed machine-learning or surrogate model might eventually approximate some of those calculations and quickly identify promising scenarios. AI could also help with:
- screening large modelling datasets
- identifying unusual model results
- predicting likely controlling scenarios
- locating patterns in monitoring data
- assisting quality-control checks
- selecting candidate monitoring locations
- emulating computationally expensive calculations for exploratory work
That does not mean an AI system should simply replace the regulatory dispersion model and declare the answer. A regulatory assessment needs traceable inputs, appropriate physics, documented assumptions, reproducible calculations and a defensible interpretation. AI can become another tool in that workflow. Professional judgement remains essential.
At Calvin Consulting, we take a careful, evidence‑driven approach to emerging tools such as AI, surrogate modelling, and automated modelling analysis. These technologies show promise, but meaningful use in our field requires confidence in their reliability and clarity around the ethical implications.
We are actively developing expertise, and we will speak to these capabilities once we are satisfied that they meet our standards for scientific integrity and responsible practice. For now, they remain early‑stage work in progress.
Computers in meteorology come to work at Calvin
Calvin Consulting does not operate a national weather forecast centre. Our computers have a much smaller job. They still have plenty to do. Our dispersion modelling team currently uses Windows laptops with Intel i7 processors to run AERMOD and CALPUFF.
That sounds modest compared with the computing systems used by NOAA, Environment and Climate Change Canada or ECMWF. It is.
A national weather centre may be simulating the atmosphere over an entire continent or globe. Calvin may be assessing one industrial facility at a time. Yet a five-year modelling dataset still contains more than 40,000 hourly meteorological conditions. And those hours may be combined with hundreds or thousands of receptor locations and numerous emission sources.
Suddenly the laptop has a respectable workload.
What happens to all those hours?
First, we need to understand the meteorological data. At Calvin, we use tools such as WRPlot View from Lakes Environmental Software to examine meteorological data at a glance.
Wind roses make dominant wind directions and wind-speed distributions easy to see. We also examine the data more closely during modelling and quality control. The purpose isn't to produce a pretty graph.
It is to understand the atmosphere that the model will be asked to represent.
A five-year dataset might contain 43,800 hourly conditions. Those conditions can produce very different dispersion outcomes.
A calm night is different from a windy afternoon and a stable atmosphere is different from strong daytime mixing. A west wind puts a plume somewhere very different from an east wind.
The model calculates those differences. The modeller has to understand them.
From weather data to an air-quality answer
This is where computers in meteorology connect directly to environmental consulting. A typical Calvin dispersion assessment can follow this chain:
Meteorological data
↓
AERMET or other preprocessing
↓
AERMOD or CALPUFF
↓
Thousands of predicted concentrations
↓
Statistical analysis
↓
Maximums, percentiles and exceedances
↓
Concentration maps
↓
Engineering and regulatory interpretation
The computer handles an enormous amount of arithmetic. Then we have to decide whether the result makes sense.
We don't just run the model once
One of the most useful things a computers in meteorology allow an environmental modeller to do is experiment. Suppose an industrial source is predicted to produce a high concentration near a facility.
We might test a different stack height. What happens?
Try a different stack location. What changes?
Add supplemental fuel to a flare. Does the increased plume rise offset the increased emissions?
Split the flow between two stacks. Does that improve dispersion?
Change the operating scenario. Does the controlling receptor move?
Add waste-heat recovery. Does the lower exhaust temperature materially change the predicted dispersion?
They might seem like random computer games, but these are engineering sensitivity tests. They help identify which design parameters actually matter.
At Calvin, modelling can therefore become part of facility design rather than simply a final regulatory checkbox.
A flare is a particularly good example
Flare behaviour can be surprisingly complicated. Gas composition, H₂S rate, flow rate, flare geometry, heat release, assist gas and combustion conditions can all affect the release.
Modern AERflare applications can represent flare conditions that vary with time rather than assuming one static emission scenario for every hour. That gives the model a more realistic description of how a facility operates.
It also creates more data to understand. A modeller may need to determine which operating and meteorological combinations produce the controlling result. This is where computing power is useful.
It is also where professional judgement becomes more important.
Computers in meteorology can run thousands of scenarios. It cannot decide whether those scenarios represent the facility properly.
The data need to make sense before the model runs
This is where experience becomes difficult to automate. At Calvin, source information supplied by a client or engineering firm is checked against other available information and against what makes physical sense. We may examine:
- stack dimensions
- flow rates
- exit velocities
- temperatures
- emission rates
- source locations
- equipment characteristics
- operating scenarios
Provincial and federal emissions databases can also provide useful comparison information.
An unusual number deserves investigation. It doesn't automatically deserve correction. It could be an unusual source. It could be an equipment-specific characteristic. It could be an error.
The job is to find out which.
The same computer can produce a beautiful wrong answer
This is probably the most important warning on this page. A model can run successfully. The output can look professional. The colours can be beautiful. The contour map can look scientific.
And the assessment can still be wrong.
Perhaps the stack height was entered incorrectly. Perhaps the wrong emission rate was used. Perhaps the meteorological dataset wasn't appropriate. Perhaps a building was missing from the downwash calculation. Perhaps the wrong operating scenario was chosen.
Perhaps the model is answering a different question from the one the project actually needs answered. The computer doesn't know.
It will calculate. The modeller has to think.
Quality control is where expertise pays for itself
At Calvin, senior modellers review modelling work through QA/QC procedures.
That includes looking at the model setup and the results rather than simply checking whether the program completed successfully. We may ask:
- Do the source parameters make sense?
- Does the wind rose look reasonable?
- Does the maximum concentration occur where expected?
- Does the plume move the way the terrain and wind suggest?
- Which scenario controls?
- What changes when the stack height changes?
- Why did the maximum move?
- Are the regulatory statistics being extracted correctly?
Those questions are difficult to turn into a simple software checkbox. They are accumulated professional experience.
This is where modelling becomes falsifiable
A useful scientific model gives us something we can question. Suppose AERMOD predicts the maximum one-hour average concentration 150 metres east of a facility. We can ask:
- Why east?
- Was the prevailing wind from the west?
- Was the maximum associated with a particular stability condition?
- Was building downwash involved?
- Did another scenario put the maximum somewhere else?
- Could monitoring confirm the predicted pattern?
Those questions make the model useful. A prediction that cannot be challenged is much less scientifically interesting. Good modelling leaves us something to check.
A computer doesn't understand the atmosphere
It manipulates numbers according to algorithms. That's enough to perform enormous calculations.
Understanding the atmosphere is our job. That means knowing enough meteorology to recognize:
- stable and unstable conditions
- boundary-layer behaviour
- wind shifts
- terrain effects
- plume rise
- building downwash
- unusual source behaviour
- the difference between a plausible result and a strange one
This is why the phrase computers in meteorology should never be interpreted as meteorology without meteorologists.
The computer changed the scale of the problem. It did not remove the need to understand the problem.
Where should you go next?
This page is part of a larger journey through meteorology and air quality.
Start with the atmosphere
What Is Meteorology? The basic science of the atmosphere.
Weather Forecasting - How observations and models become forecasts.
Weather Technology - Satellites, radar and other observing systems.
Explore the mathematics
Examples of Models in Math - Why scientists simplify reality into mathematical models.
Air Quality Statistics - How thousands of observations and model results become useful information.
Follow the modelling into air quality
What Is Air Quality? How emissions become ambient concentrations.
Air Dispersion Model - How to choose an appropriate dispersion model.
AERMOD: Alberta's Workhorse Air Dispersion Model
How a regulatory dispersion model works.
Air Quality Dispersion Modelling - The deeper technical guide.
Keep going
The original purpose of Stuff in the Air was to explain weather and atmospheric science without requiring a graduate degree in mathematics.
That idea still works. You don't need to understand every equation inside a weather model to understand the basic idea. But once you see what the computer is actually doing, meteorology becomes much more interesting.
The specialist still matters
This is especially important when the computer output becomes part of an engineering or regulatory decision.
You can install modelling software. You can download meteorological data. You can learn the commands. You can produce a plume plot.
The difficult part is deciding:
- Which data belong in the model?
- Which sources matter?
- Which scenarios need to be tested?
- Is the model appropriate?
- Is the meteorology representative?
- Does the result make physical sense?
- What happens when the design changes?
- Which result actually controls the regulatory decision?
A modelling mistake discovered early is usually an inconvenience. A modelling mistake discovered after an engineering design, regulatory submission or approval process has been built around it can become expensive rework.
That is why specialist involvement is valuable before the computer starts doing the heavy lifting. At Calvin Consulting Group, our modelling work combines the computational tools with meteorology, source characterization, engineering understanding, sensitivity testing and senior QA/QC.
The computers do the calculations. We make sure the calculations are answering the right question.
And that is the part of computers in meteorology that matters most.
Can you do it better?
You like this Idea? It works for its intended purpose, but probably is not perfect. Why not?
Do you know of a better one? We'd all like to see it, I'll bet. A penny for your thoughts.
Other people and their ideas...
Click below to see hi-tech contributions from other visitors to this page...

air quality handbook 
I have work in the educational project of pollutions in the factories. please you can help me find the right air quality handbook or references.
Barry's …

Air dispersion models
I am wondering about air dispersion models. What is the Principle of air Quality Modeling. I am a student of M.Sc. Environmental Science from Devi …
Search this website for more information now.
Recent Articles


-
Gas Flare Output SO2 – How to control it.
Oct 04, 26 06:37 PM
 What's the best way to handle temporary flaring and its output SO2? In Directive 60, the Alberta Energy Regulator (AER) gives guidance.
-
Natural Gas Leak Detection: Does YOUR Facility Need it?
Sep 28, 26 08:40 AM
 It's important for industries, especially in the energy sector, to have a natural gas leak detection program. It's often required by law.
-
Computers in Meteorology | How Would they Help You?
Sep 26, 26 09:40 PM
 Computers in meteorology help us keep track of atmospheric data and make predictions.

A useful thought experiment for students
Choose one weather forecast for tomorrow. Then find:
- a weather model map
- a radar image
- a satellite image
- a surface observation
- the actual weather tomorrow
Ask yourself:
- What did the computer know?
- What did the observations know?
- What changed during the forecast period?
- Where was the forecast wrong?
- Did the error come from the starting conditions, the model or something smaller than the model could resolve?
This is a simple way to discover why forecasting is difficult.
It also shows why meteorologists compare observations, models and experience rather than blindly following one computer output.
Do you have concerns about air pollution in your area??
Perhaps modelling air pollution will provide the answers to your question.
That is what I do on a full-time basis. Find out if it is necessary for your project.
Have your Say...
on the StuffintheAir facebook page
Other topics listed in these guides:
The Stuff-in-the-Air Site Map
And,
Thank you to my research and writing assistants, and the author remains responsible for the content.
The real lesson
Meteorology became computer-intensive because the atmosphere is too large, too fast and too mathematically complicated to calculate by hand at useful operational speed.
Computers made numerical weather prediction possible at a scale humans could never manage manually.
Observations tell us what the atmosphere is doing.
Data assimilation creates the best available starting state.
Physics-based models calculate possible futures.
AI can now provide additional ways to learn patterns and generate forecasts. Meteorologists interpret the results.
The same computational ideas carry into climate science, hydrology, aviation, severe-weather forecasting and air-quality dispersion modelling.
That is the real history of computers in meteorology.
Rather than a story about machines replacing scientists, this is a story about machines expanding what scientists can calculate, test and understand.

By Barry Lough, P.Met., EP (Environmental Professional)
Text copyright © 2003-2026 Stuff in the Air.com
BACK TO TOP - Hit your 'Home' Key