- Air Homepage
- Upper Atmosphere
- Temperature Conversions
Temperature conversions of special types
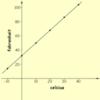
I'll start with the most familiar temperature measurements. Here are two simple temperature conversions for you.
Search for more weird possibilities.
Meteorology Math: Decoding Temperature Conversions 🌡️What if you could use a simple trick to convert Fahrenheit and Celsius without a formula, and then discover the math secret meteorologists use to predict everything?
Temperature Conversions
Learn how to read complex atmospheric data (wind barbs, layer averaging) to see storms coming just like the pros instead of going through boring temperature conversions.

Start with Celsius. Take 40 and add it. Multiply by 9. Divide by 5. Subtract 40 from that. Now you've got it in Fahrenheit.
Now the other way: Start with your Fahrenheit. Just add 40. Take that number and multiply it by 5. Then divide by 9. Subtract 40 from the result. Easy peasy.
The Fahrenheit scale is mainly used in the United States and a few other countries. Water's freezing point is 32°F, and its boiling point is 212°F. -459.67°F is absolute zero, the lowest temperature possible.
The Celsius scale is the most widely used temperature scale worldwide. It's common in science and everyday life. The freezing point of water is 0°C, and the boiling point is 100°C. The absolute zero temperature is -273.15°C.
Kelvin (K): This is an absolute temperature scale that's used in science and thermodynamics. Temperature differences and energy calculations are common uses for it. Kelvin scale starts at absolute zero, where 0 K represents no thermal energy. A Kelvin increment is the same size as a Celsius degree increment, so an increase of 1 Kelvin is the same as an increase of 1 Celsius.
Rankine is another temperature scale used in some engineering applications, especially in the US. With absolute zero being 0 Rankine (R), the Rankine scale is based on the Fahrenheit scale. Rankine scale increments are the same size as Fahrenheit degrees. Although Rankine isn't as common as Celsius, Fahrenheit, or Kelvin, it's still used in specific engineering and scientific contexts, especially in the US.
Absolute zero is the lowest temperature on any scale. All molecular motion stops at absolute zero, and substances reach their lowest possible energy state. The point where no heat can be extracted from a system is the point of minimum thermal energy. In scientific and thermodynamic calculations, absolute zero serves as the starting point for measuring temperature.
Special Temperature conversions used in meteorology
Weather forecasters use conversions to find the average temperature of any upper layer. They convert an individual temperature profile into a typical value for that atmospheric layer.
You can do this with a tephigram or skew-t chart. You can use layer averaging or other things like mixing ratios. But why? Check out these examples.
1) The type of precipitation is determined by the average temperature. It could be rain, snow, hail, or something else.
2) One can estimate atmospheric turbulence near the ground by averaging potential temperatures. That's especially true if it's sunny!
3) Check out one of these charts for the dewpoint curve. At low elevations, it shows that the air mixes well in this layer if it slopes up to the right. Warmer air moves up and cooler air moves down because of this mixing. As a result, the temperature in different layers of the atmosphere stays the same and vapour in the air are dispersed. This is a handy tool for forecasting convection, turbulence and storms.
4) Let's go back to the good old wet-bulb potential temperature. Here's another temperature conversion. It's great for finding temperatures after rain or downbursts. We can also figure out what type of air mass it is.
Here is how you can do it
Firstly, by eyeball. This is a quick, crude way to convert temperatures. The person needs to have enough skill to average this way.
Here's the formal method. Decide what layer you need an average for. Decide what parameter (isotherm, temperature, etc) you need to average. Find a value for that parameter, by trial and error if necessary, that meets this condition:
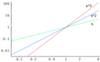
From the top of your chosen layer to the bottom, draw a single line or curve so that one side of the radiosonde curve has about the same area as the other side. Take a look at this American example...

Here's an equal area technique. The black area above the red line is roughly equal to the grey area below. With it, we figure the average temperature between 550 millibars and 650 millibars (3774 meters above sea level and 5076 meters above sea level) was -5 degrees Celsius. Our average temperature value is halfway between 0 and -10, as you can see from the straight yellow isotherms sloping down to the left.
Besides the temperature conversions, notice the hockey sticks on the right in this sample drawing. These are in a lot of plots. Wind speed and direction are displayed at corresponding heights. We get this data from the balloon's trajectory, not stationary wind meters.
A long spike means 10 knots, which is about 11 mph or 19 km/h, a half spike means 5 and a black flag (pennant-shaped, not shown in this example) means 50. In addition, the shaft angle shows the upwind direction, with most of these in the picture above showing westerly or northwest winds near the surface.
Go back from Temperature Conversions to the
Chasing Storms webpage. If you have anything to add, please leave your comment right here.
We are NOT Geeks
At least that's what some people think. Do you think math helps us to understand our world? Succeed at work? Use a computer?
You bet. That reminds me, it can help make you a better gambler if you're so inclined.
What's the most important thing math helps you with?
What Other Great Mathemeticians Have Said...
Click below to see contributions from other visitors to this page...

Saturday air 

how is climate on saturday?
Barry's Response - Saturday air? Climate on a particular day of the week? An interesting situation.
I will start …

Math and Statistics Not rated yet
i just love math.. but statistics.. hmmm i almost failed my statistics exam. :) But then again... you cannot do anything in life without statistics and …
More specific details Not rated yet
Okay, this is alright. Of course people can understand, but just reading all that words makes me so dizzy. To be honest, I'd rather see more + and - and …
Math can be useful in determining truth vs perception Not rated yet
Math can be very useful when trying to make a decision that involves money, or time and distance, or building, or many other things. We can "feel" or …
Weather math Not rated yet
This description moves a little too quickly and might use too many English idioms ("eyeballing it") for younger readers to follow along.
I do data visualization …

There are 10 types of people in the world... Not rated yet
Those who understand binary and those who don't. I use basic math algorithms daily when writing code snippets for my customers. I often think back on …

#31
Search this site for more information now.
Recent Articles
-
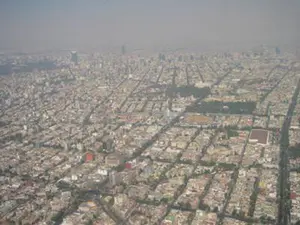
What causes pollution in the outside?
May 12, 26 12:44 AM
 The Hidden World of Pollution - Does the air you breathe have anything to do with a distant volcano or a dusty farm field? There's more to the gray haze
 -
UNDERWEAR AND POLLUTION
May 11, 26 12:12 AM
 Can Underwear Save the Earth? - What if your favorite pair of underwear were the only thing stopping a climate catastrophe? The hilarious truth about farts,
 -
Levi Mays Story about little boys
May 09, 26 07:06 PM
 The Secret History of Hot Air - Ever feel like there's more to what you see on the news? Get your detective gear on because we're diving into a world of

Here are some temperature conversions you may not have seen before...
Temperature conversions for scientists - a new way to look at temperatures.
Do you have concerns about air pollution in your area??
Perhaps modelling air pollution will provide the answers to your question.
That is what I do on a full-time basis. Find out if it is necessary for your project.
Have your Say...
on the StuffintheAir facebook page
Other topics listed in these guides:
The Stuff-in-the-Air Site Map
And,
Thank you to my research and writing assistants, ChatGPT and WordTune, as well as Wombo and others for the images.
OpenAI's large-scale language generation model (and others provided by Google and Meta), helped generate this text. As soon as draft language is generated, the author reviews, edits, and revises it to their own liking and is responsible for the content.
By Barry Lough, P.Met., EP (Environmental Professional)
Text copyright © 2003-2024 Stuff in the Air.com
BACK TO TOP - Hit your 'Home' Key
New! Comments
Do you like what you see here? Please let us know in the box below.